Reading trading charts is a crucial skill for any trader looking to make profit. Adding technical indicators to trading charts can help identify the right time to place a trade or predict the price movements of particular markets.
On BitMEX, our goal is to provide users with the necessary tools to maximise their crypto trading, in a straightforward and easy manner.
This guide will show you how to set up your trading chart with the most essential indicators such as the MACD indicator and Bollinger Bands, so that you can make informed trading decisions.
Let’s dive in.
If you haven’t signed up for a BitMEX account yet, we’re currently offering $5,000 worth of BMEX Tokens to new users – you can register here.
What are Trading Chart Indicators?
Trading chart indicators are tools that analyse historical price action and trading volume. They help you spot trends, gauge momentum, and identify potential entry and exit points.
While no indicator is foolproof, they are a vital part of any trading strategy.
On BitMEX, you can choose from hundreds of indicators. Some of the most popular indicators used include…
- Moving Average (MA): Smoothes out price data over time to help you identify the direction of a trend.
- Relative Strength Index (RSI): Measures the speed and change of price movements. It can signal when an asset is overbought or oversold.
- Moving Average Convergence Divergence (MACD): A momentum indicator that shows the relationship between two moving averages of a security’s price. It is used to identify trend changes and momentum.
For a more detailed guide on some of the most commonly used trading chart indicators on BitMEX, read our article The Ultimate Guide to Trading Indicators.
A Step-by-Step Guide to Adding Trading Chart Indicators
You can start adding indicators to your BitMEX trading chart in a few easy steps.
- Log in to your BitMEX account. Navigate to the trading interface for the contract you want to trade.
If you haven’t signed up for a BitMEX account yet, we’re currently offering $5,000+ in rewards to new users – you can register here.
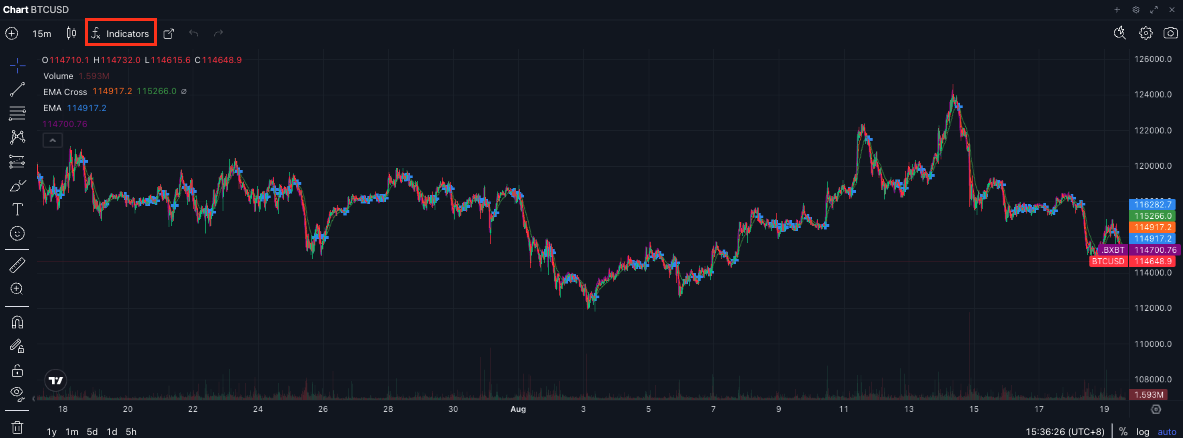
2. Locate the “Indicators” button. You will find it at the top of your chart, next to the timeframes and other chart tools.
3. Search for your desired indicator. Type the name of the indicator, such as “RSI” or “Moving Average” into the search bar.
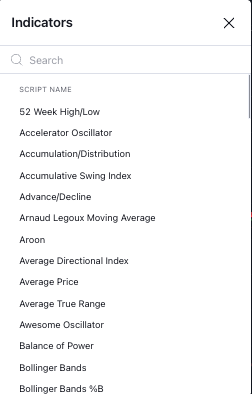
4. Select the indicator from the dropdown list. It will automatically be added to your chart.
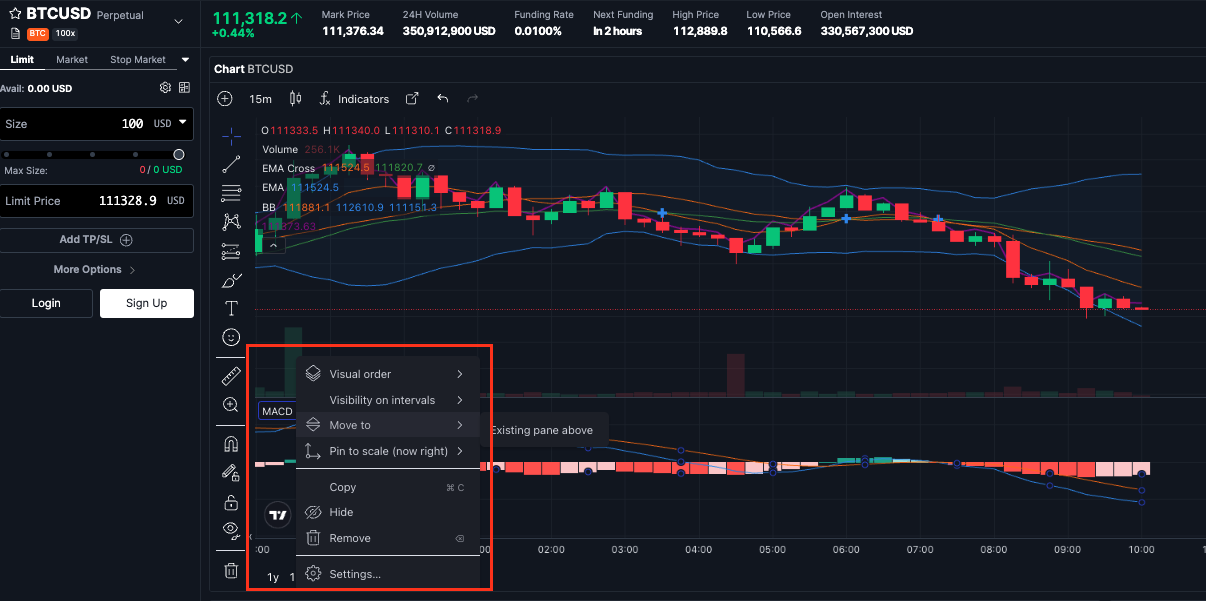
5. Click on the three dots next to the indicator to customise the settings. A pop-up will appear, allowing you to adjust the indicator’s parameters. You can change the visual order, intervals, or click on ‘Settings’ to access more advanced personalisation.
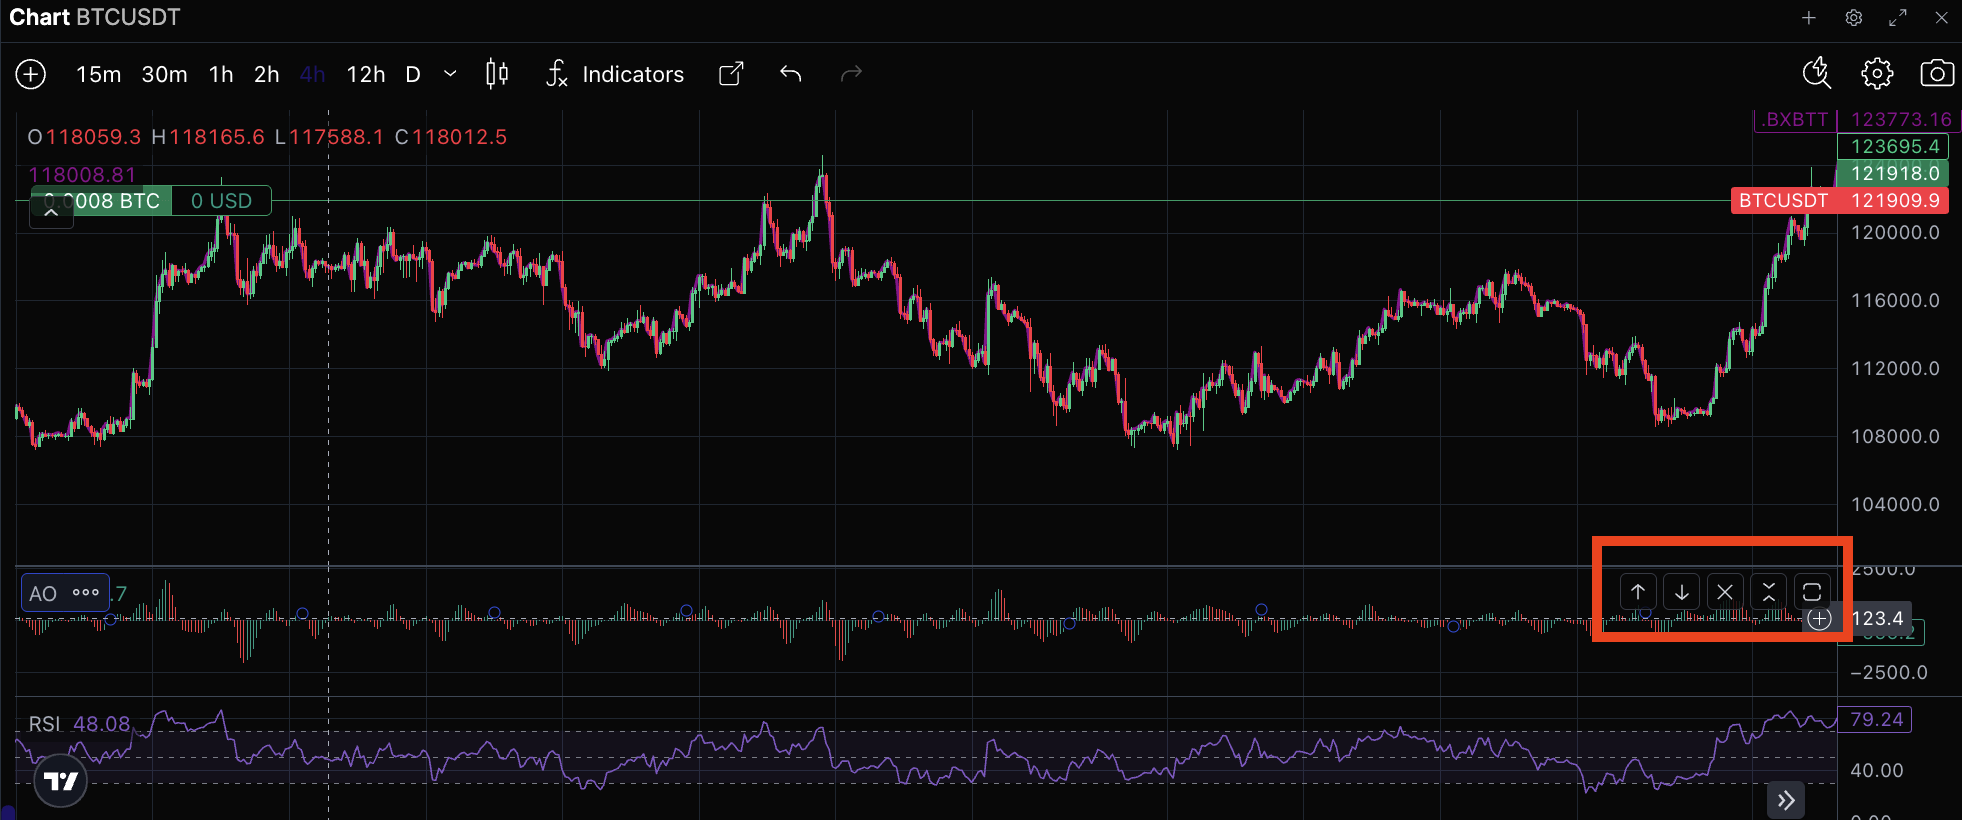
 Additionally, you can use the buttons on the right to perform quick actions such as repositioning your indicators or minimising them.
 6. You can add multiple indicators to your chart. We recommend using 2-3 complementary indicators to avoid overcrowding the chart.
If you would like to try using indicators on your BitMEX trading charts, you can do so here. For more educational resources on crypto trading, visit this page.
If you haven’t signed up for a BitMEX account yet, we’re currently offering $5,000+ in rewards to new users – you can register here.
To be the first to know about our new listings, product launches, giveaways and more, we invite you to join one of our online communities and connect with other traders. For the absolute latest, you can also follow us on Twitter, or read our blog and site announcements.
In the meantime, if you have any questions, please contact Support who are available 24/7.