On June 4, 2025, TRUMP/USDT formed an ascending channel pattern on the 1-hour timeframe.
An ascending channel appears when price moves between two upward-sloping, parallel trendlines, often showing a gradual uptrend with controlled momentum.
Currently, the price trades at $11.15 and touches the lower trendline of the channel. The 50-period Exponential Moving Average, now at $11.25, acts as a dynamic resistance just above the price.
If the price breaks above the upper channel boundary and confirms the breakout, TRUMP/USDT may rally toward the projected target of $12.36, representing a 10.85% potential increase from the current level.
The pattern has already been tested once with a rejection near the top boundary. That spike shows early bullish pressure, but the price must now hold above the lower trendline and break the upper boundary for confirmation.
Volume remains moderate, and bulls must regain momentum to push past the channel resistance and reclaim the 50-period Exponential Moving Average. A close above this zone would validate the upside breakout scenario.
TRUMP/USDT RSI Shows Weak Momentum Recovery
The 14-day Relative Strength Index (RSI) for TRUMP/USDT stands at 43.48, with its moving average at 43.27.
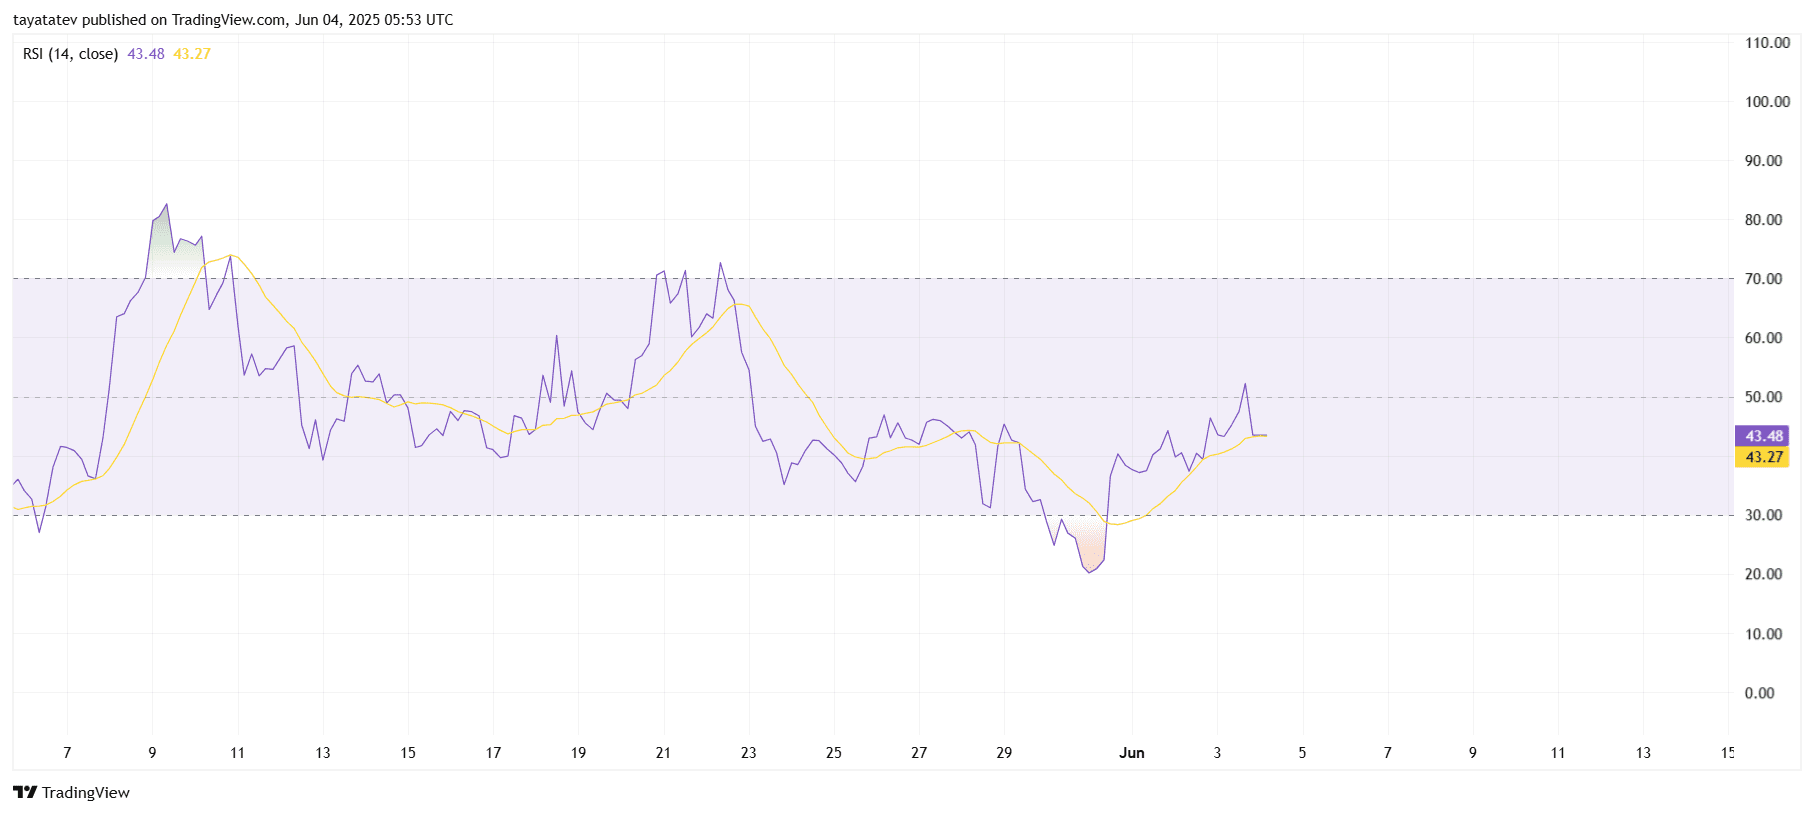
The Relative Strength Index measures price momentum, with values below 50 indicating bearish pressure and levels under 30 signaling oversold conditions. In this case, RSI recently bounced from the oversold zone near 30 on June 1, showing a minor recovery.
However, the RSI remains below the 50 neutral midpoint, suggesting that bulls have not regained full control. Although the RSI line has crossed above its moving average, the slope is flat, and no strong momentum shift is visible yet.
For now, the RSI reflects weak buying interest. A clear push above the 50 level would support bullish continuation from the ascending channel structure seen in the price chart.
TRUMP/USDT Stalls Below Resistance on Bollinger Band Squeeze
On June 4, 2025,TRUMP/USDT traded at $11.16 on the 4-hour chart and moved inside a narrow Bollinger Band structure, showing volatility compression.
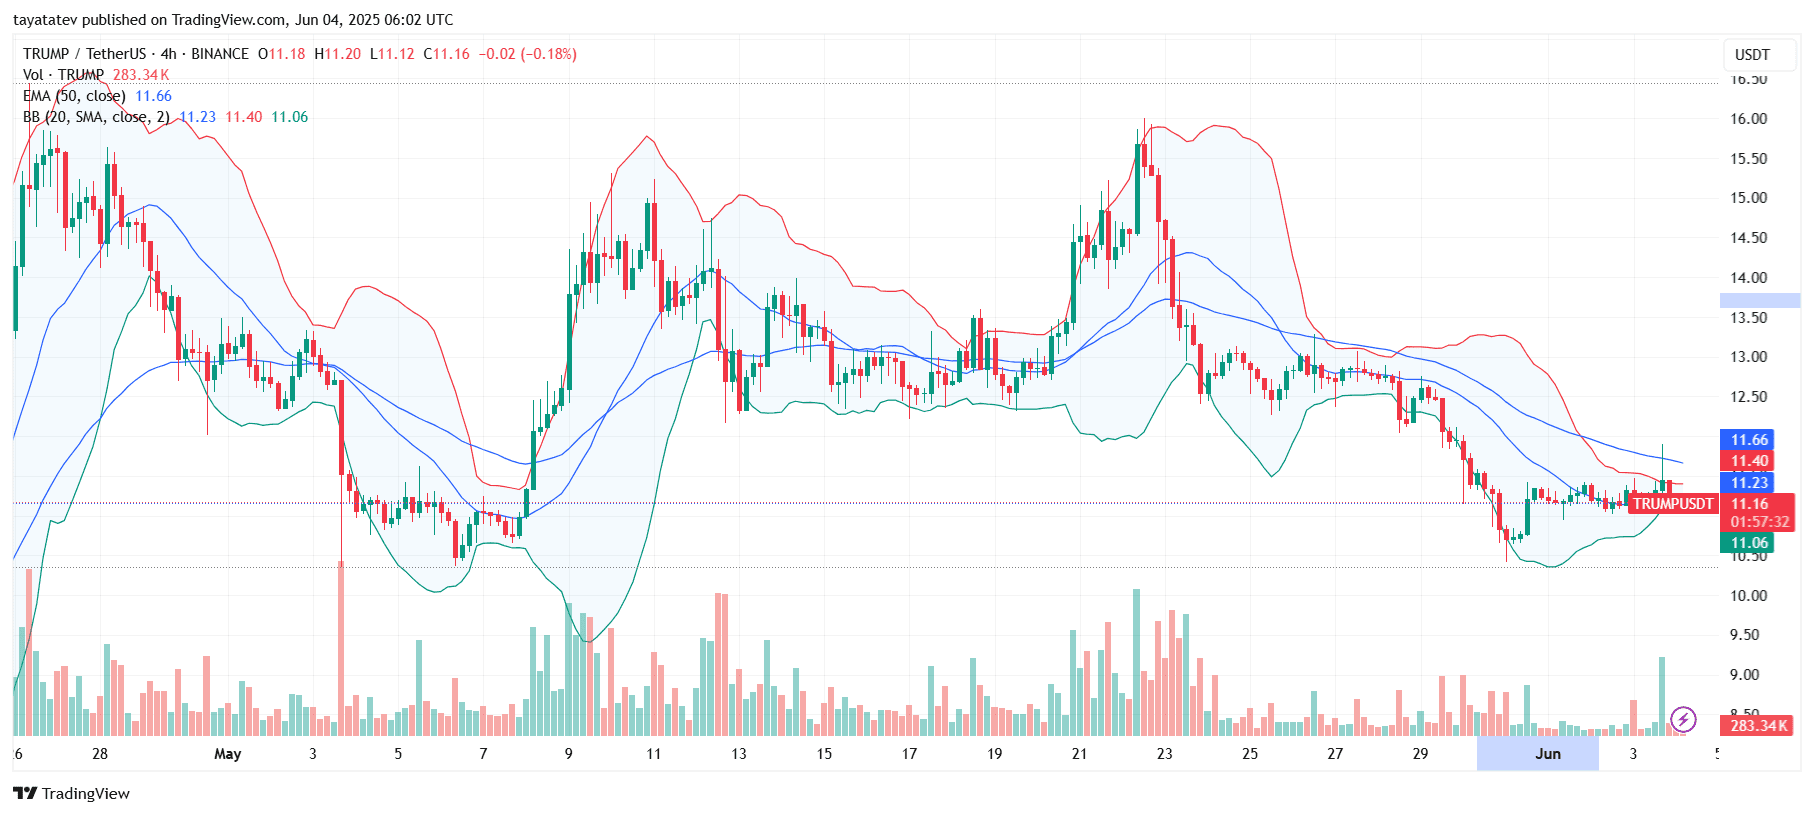
The Bollinger Bands (20-period Simple Moving Average with 2 standard deviations) are tightening, with the midline at $11.23, upper band at $11.40, and lower band at $11.06. Tight bands often indicate that a major price move may follow.
Price recently touched the upper Bollinger Band but failed to break it, suggesting resistance near $11.40. Meanwhile, the 50-period Exponential Moving Average stands at $11.66, reinforcing overhead resistance.
Volume spiked during the last session, but price failed to close above the mid-band, indicating weak bullish follow-through. For upward momentum to build, TRUMP must close above both the upper Bollinger Band and the 50-period Exponential Moving Average.
Until then, the squeeze continues. A break above $11.40–$11.66 could trigger a sharp move, while failure to hold $11.06 risks a downside drop.
TRUMP/USDT Stochastic Momentum Index Dips Below Midline
Meanwhile, the Stochastic Momentum Index (SMI) for TRUMP/USDT turned bearish. The SMI line (blue) sits at –49.35, while the signal line (orange) reads –34.74, both pointing down.
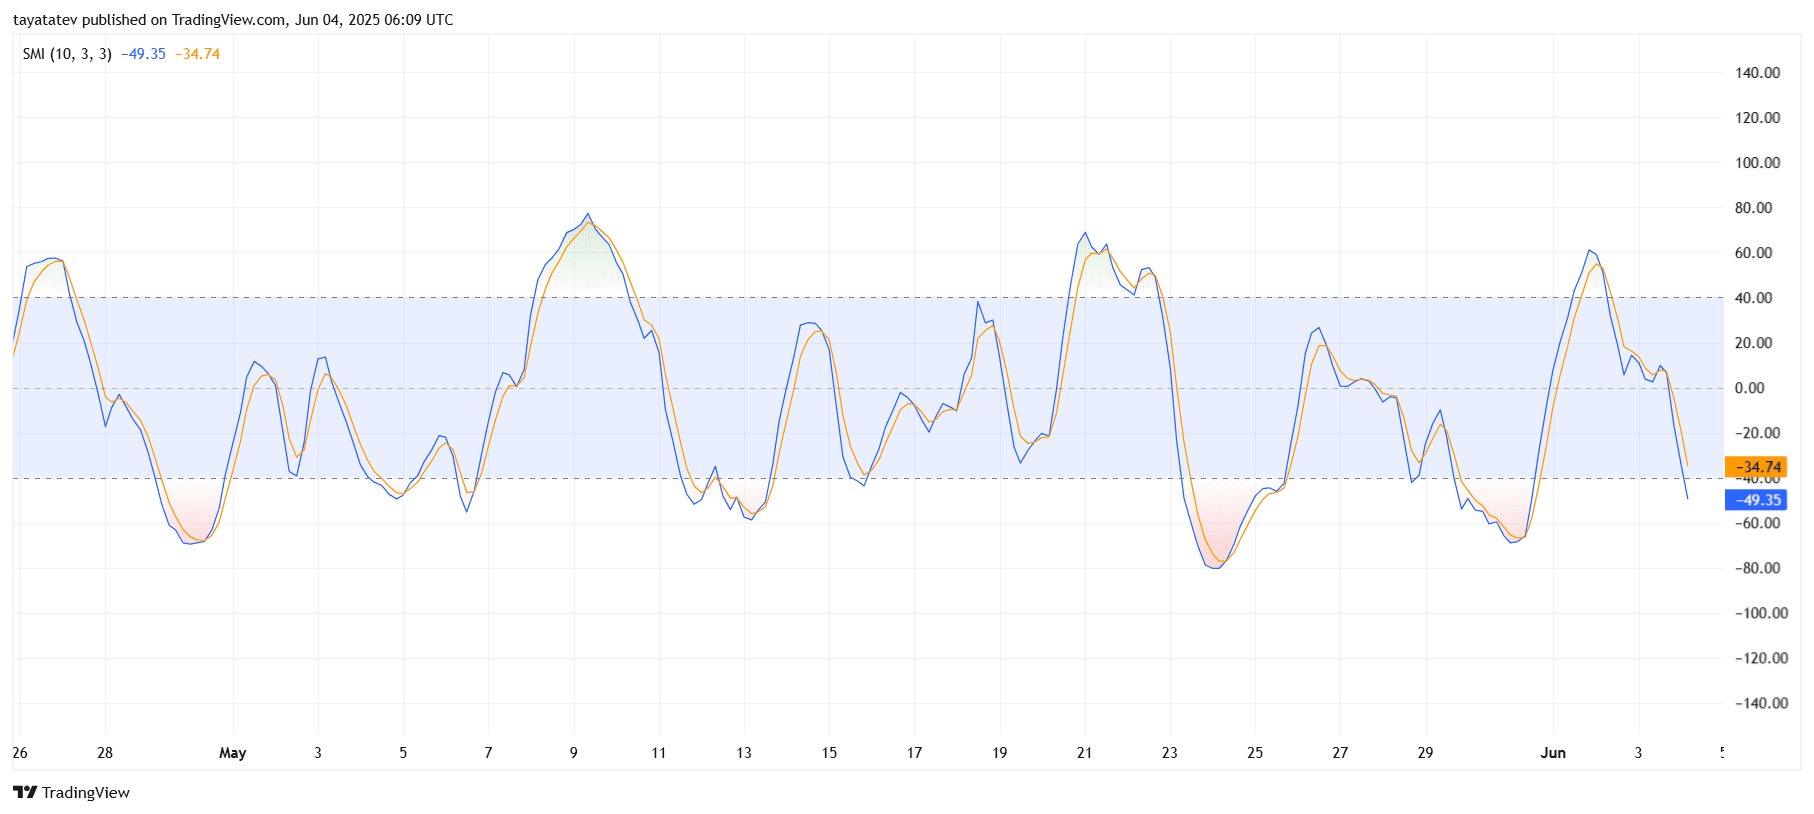
The SMI measures price momentum relative to recent highs and lows. When the blue line crosses below the orange signal line and both move under the mid-range (0), it signals weakening bullish pressure.
This chart shows that momentum sharply reversed after reaching above the 40 level in early June. The crossover happened inside the neutral zone and now trends toward the oversold region (below –50), hinting at growing selling pressure.
Unless the lines reverse upward and reclaim the midline, TRUMP/USDT may continue facing bearish momentum in the short term.
TRUMP/USDT Directional Movement Index Shows Weak Trend Strength
On June 4, 2025, the Directional Movement Index (DMI) for TRUMP/USDT reflects indecisive trend strength. The +DI (blue) sits at 22.12, the –DI (orange) at 18.43, and the ADX (red) at 24.02.
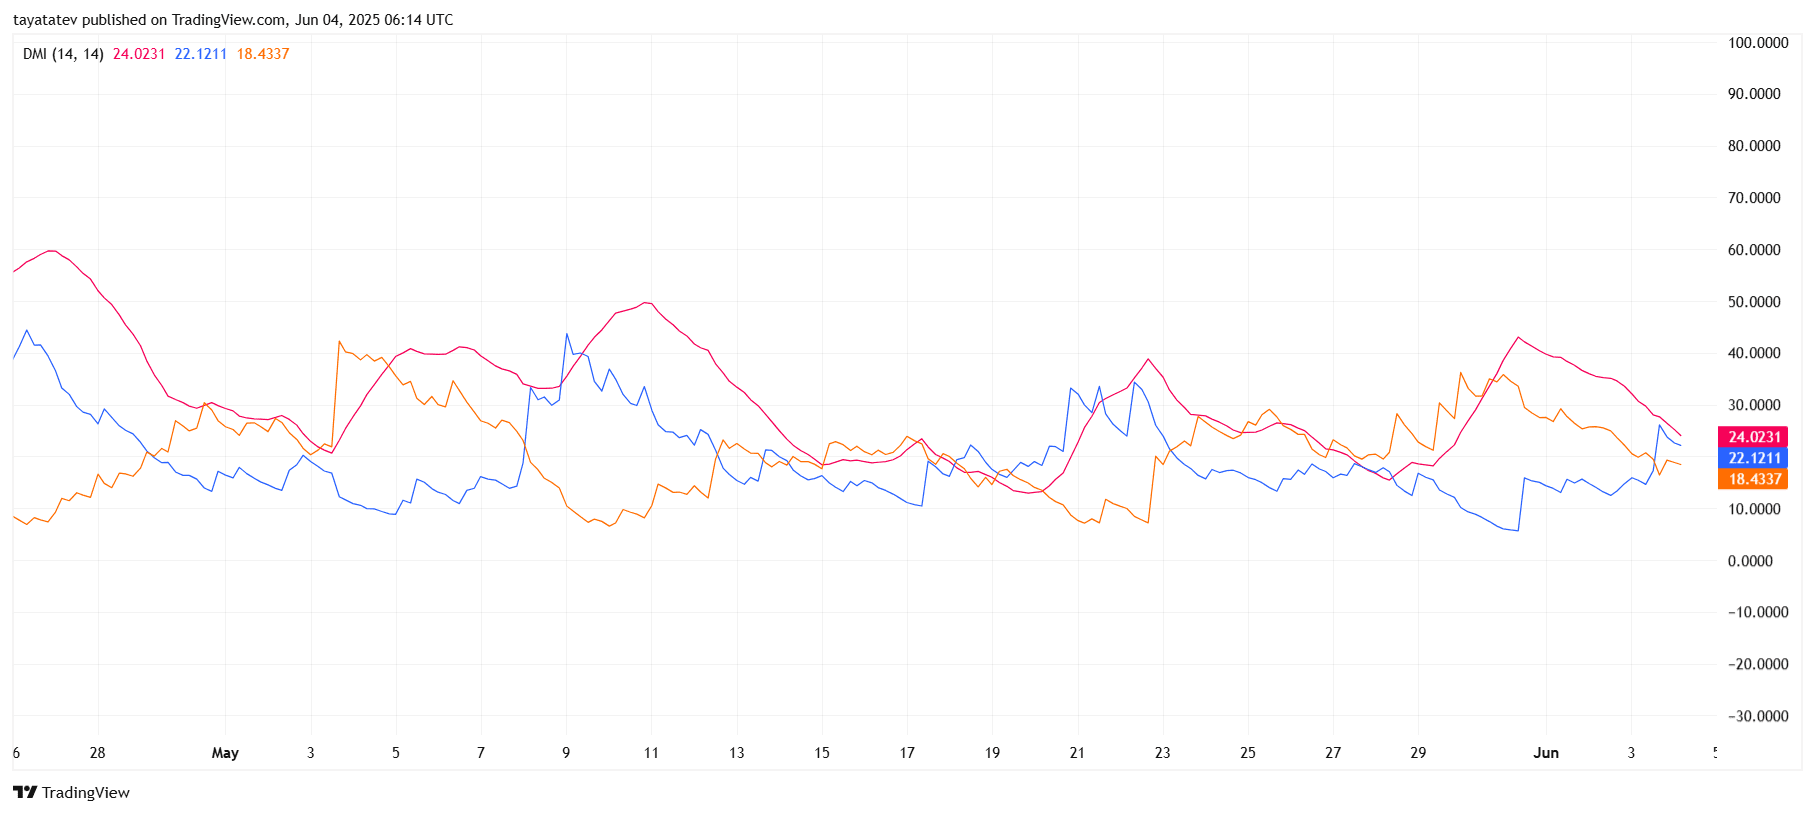
The DMI indicates trend direction and strength. When the Average Directional Index (ADX) is below 25, it signals weak or no trend. In this case, ADX has dropped near 24, showing a fading trend.
The +DI remains above –DI, suggesting a slight bullish bias, but the gap is small, and both lines stay close. This narrow spread confirms the market is consolidating, with neither buyers nor sellers holding strong momentum.
Unless ADX rises above 25 and either DI line makes a sharp move, TRUMP/USDT may stay range-bound.
Trump’s Truth Social Advances Bitcoin ETF Listing with NYSE Arca Filing
On June 3, 2025, NYSE Arca—the fully electronic arm of theNew York Stock Exchange—filed a Form 19b-4 to list the Truth Social Bitcoin ETF, marking a key step toward making the fund available to public investors. The move brings Donald Trump’s media platform closer to launching a spot bitcoin exchange-traded fund.
The proposed ETF aims to mirror Bitcoin’s price performance, offering investors exposure to the cryptocurrency without needing to hold the asset directly. This filing follows a broader strategy from Trump Media & Technology Group, which recently partnered with Crypto.com to roll out various digital asset products.
Back in March, Trump Media and Crypto.com announced plans to launch token baskets and ETFs branded under the Trump Media name. These products will mix traditional securities with digital tokens—such as Bitcoin and Cronos, Crypto.com’s native asset—and will be distributed globally through major brokerage platforms and the Crypto.com app, which serves over 140 million users.
Meanwhile, Trump Media revealed a $2.5 billion Bitcoin treasury plan last week in Las Vegas, reinforcing its crypto push. The firm also secured trademarks tied to digital assets, signaling long-term commitment.
Since January 2024, when spot bitcoin ETFs debuted in the U.S., total assets have surged past $130 billion. BlackRock’s iShares Bitcoin Trust (IBIT) dominates the sector with nearly $69 billion under management.
Trump remains the majority owner of Trump Media. If the ETF receives regulatory approval, it would become one of the most politically-linked crypto investment products in the market.