Nine major financial firms, including Fidelity and VanEck, have updated their Solana (SOL) ETF filings to include staking provisions, signaling a coordinated push to meet U.S. Securities and Exchange Commission (SEC) expectations. The updates come as the SEC intensifies its review process and political sentiment shifts in favor of digital assets.
Applicants Align Filings with SEC Guidance
All nine applicants amended their filings by July 31, 2025, to address staking, a feature central to Solana’s ecosystem, where over 67% of its token supply is locked. VanEck and 21Shares were among the earliest entrants, first filing in June 2024. Both firms added staking language in their June 2025 amendments. Analysts say 21Shares could move faster due to its previous success with crypto ETFs.
Later applicants followed suit. Canary Funds included staking in its Canary Marinade Solana Trust filing, while Bitwise updated its proposal in June and submitted its 19b-4 rule filing in January. Grayscale is working to convert its Solana Trust into an ETF but faces a delayed SEC review now extended to October 10.
More recent filers—Franklin Templeton, Fidelity, CoinShares, and Invesco—have also added staking provisions. Invesco partnered with Galaxy Digital to file in June, submitting its 19b-4 paperwork shortly before the July 30 deadline.
The SEC’s approach mirrors its reviews of Bitcoin and Ethereum ETFs, with each 19b-4 submission triggering a 240-day decision window. However, growing institutional interest and a pro-crypto post-election climate could expedite approvals.

Potential Impact on Solana and Investors
If approved, these ETFs could transform market access to Solana. They would provide institutions with regulated exposure, boost liquidity, and simplify SOL ownership for investors. Staking integration may also allow ETF holders to benefit from on-chain rewards, bridging traditional finance and blockchain participation.
Analyst MartyParty noted that uniform staking disclosures reflect “a clear attempt to align with SEC signals,” underscoring a united front among applicants.
Solana’s ETF race now mirrors the path of Bitcoin and Ethereum products but with added staking benefits, positioning the asset for deeper institutional adoption and greater portfolio relevance.
Solana Forms Bullish Falling Flag Pattern on August 1, 2025
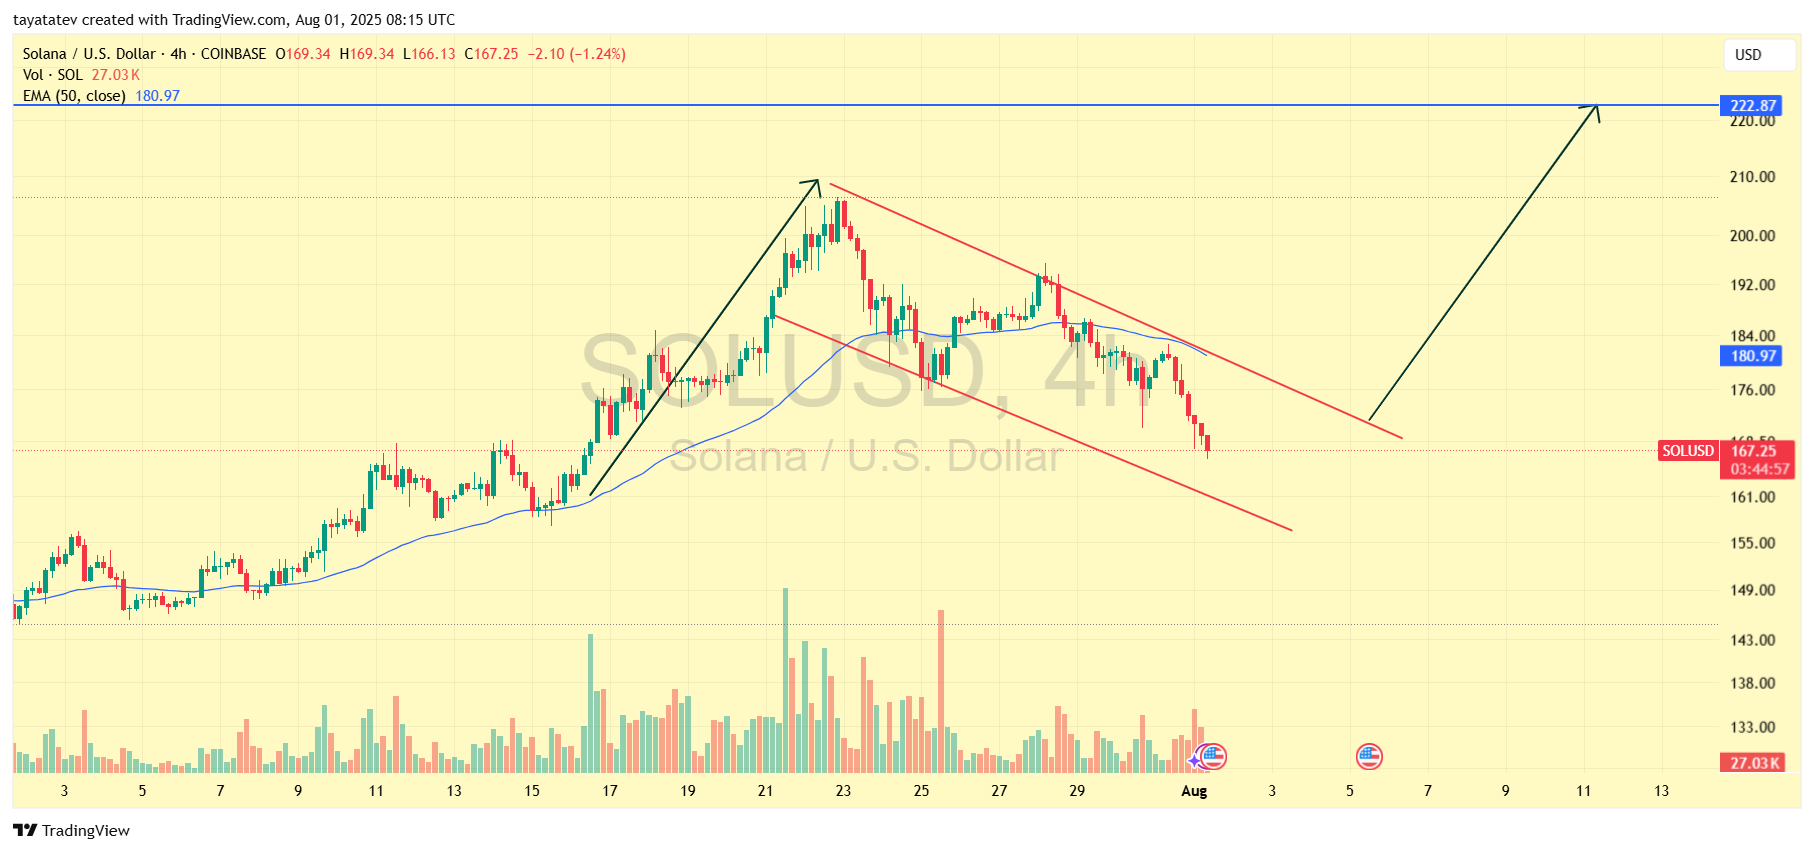
The Solana SOL/USD chart created on August 1, 2025, shows a bullish falling flag pattern. This pattern forms after a strong upward move, followed by a downward-sloping channel with parallel lines. It usually indicates a temporary pause before the trend continues upward.

The pattern suggests that once Solana breaks above the upper trendline, it may confirm a continuation of its previous rally. If confirmed, this breakout could project a price increase of around 33 percent from the current level of $167.25 to approximately $222.87.
The price is currently consolidating within the flag while staying below the 50-period Exponential Moving Average (EMA), set at $180.97. A decisive move above this EMA and the flag’s resistance would likely signal renewed bullish momentum. Rising trading volume near the breakout point would further validate this pattern.
This setup highlights how Solana’s ongoing consolidation may precede another significant upward move, aligning with the historical behavior of falling flag patterns that often act as continuation signals in strong trends.

Solana RSI Analysis on August 1, 2025
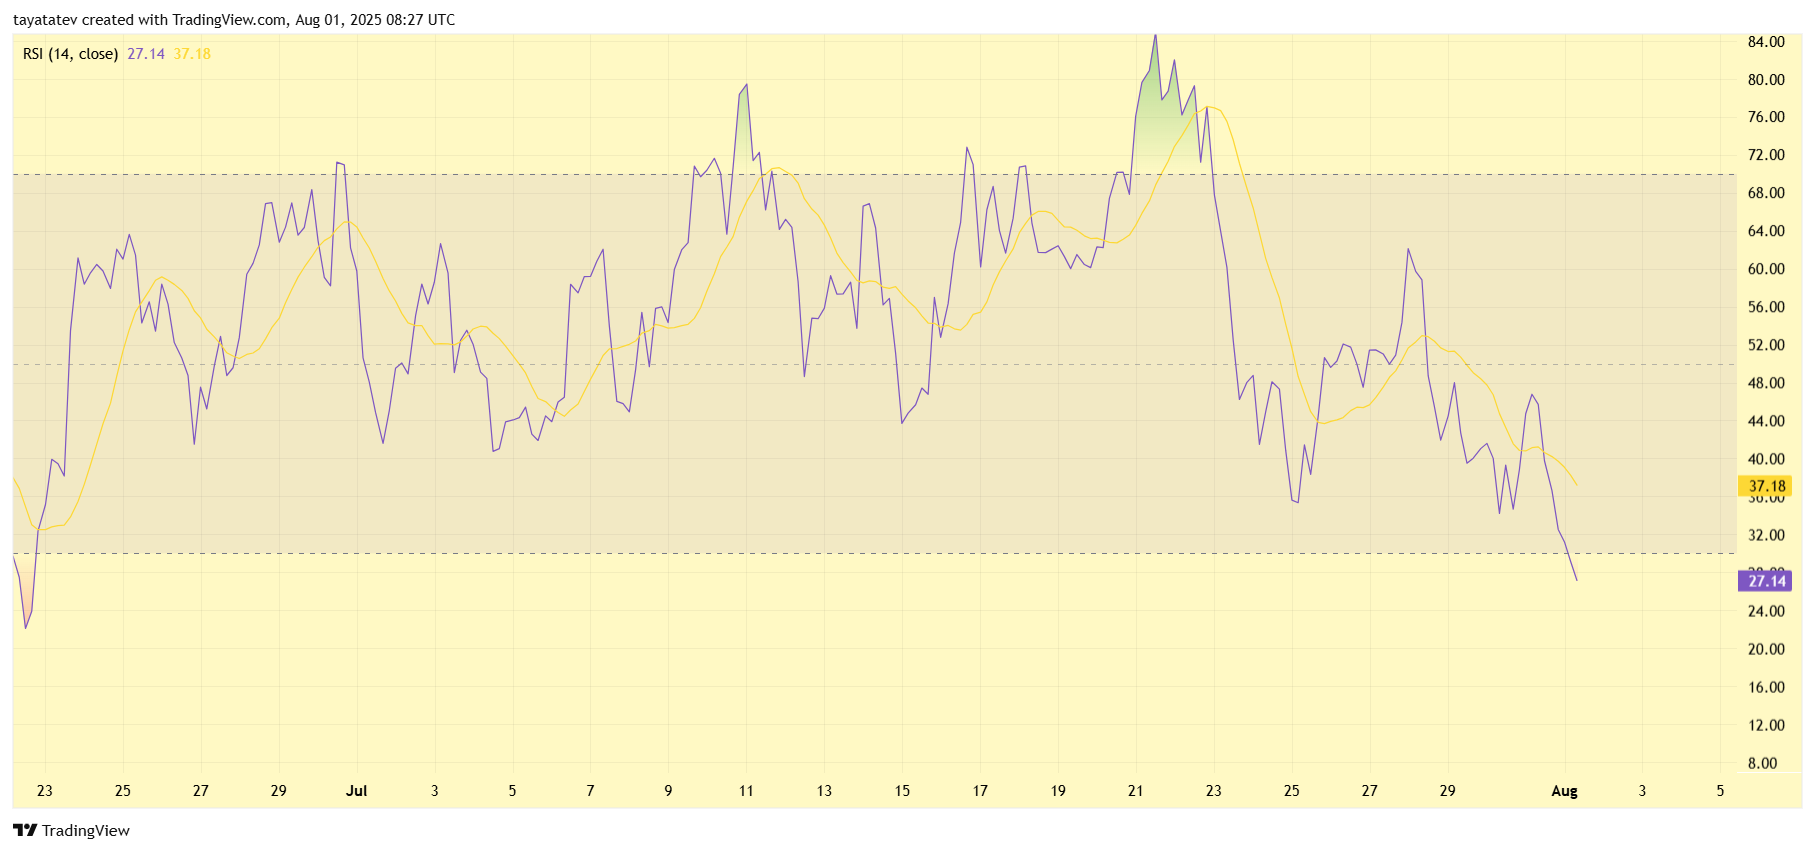
The Relative Strength Index (RSI) for Solana, shown on August 1, 2025, is at 27.14, which places it in the oversold zone below the 30 level. An RSI in this range often signals that selling pressure has reached an extreme level, and it may indicate a potential rebound if momentum shifts.

The RSI has been declining steadily from its recent peak near 80, reflecting strong bearish pressure over the past several sessions. The moving average of the RSI, currently at 37.18, also trends downward, confirming a sustained weakening in buying strength.
Oversold readings like this often precede short-term price recoveries, especially if accompanied by bullish patterns or support levels on the price chart. If the RSI turns upward from this oversold zone, it may align with the bullish falling flag seen in the price chart, potentially supporting a move toward higher levels.
This alignment between oversold RSI and a bullish continuation pattern strengthens the case for a possible reversal if market momentum shifts back in favor of buyers.
Solana MACD Analysis on August 1, 2025
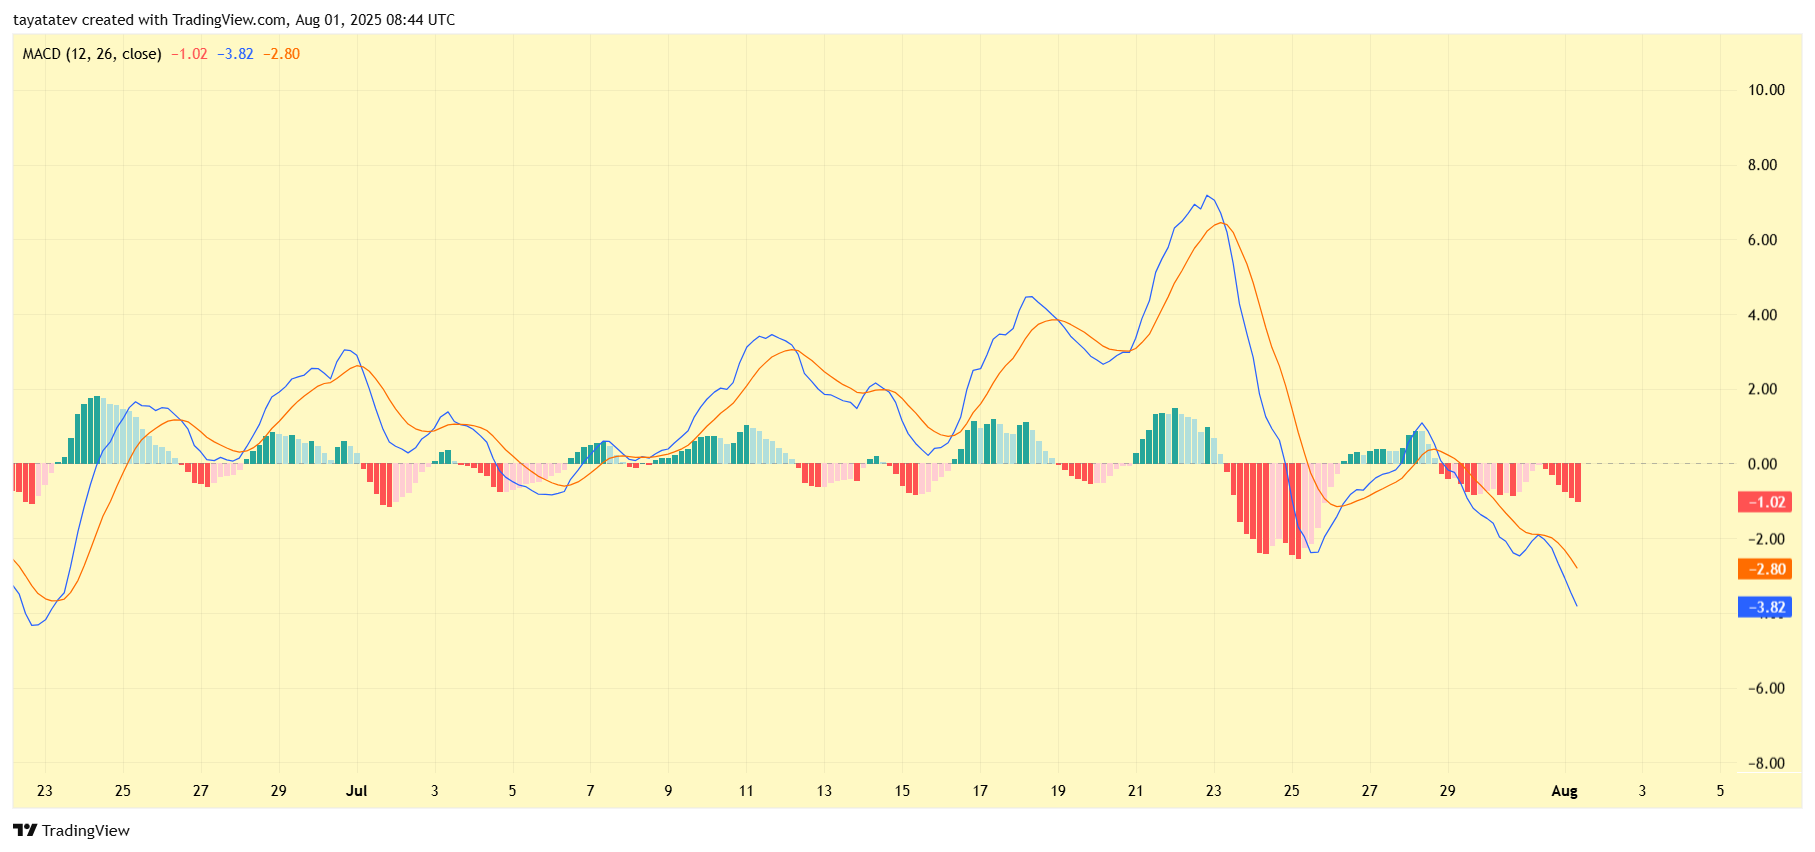
The Moving Average Convergence Divergence (MACD) for Solana, dated August 1, 2025, shows bearish momentum. The MACD line is at -3.82, below the signal line at -2.80, and both remain in negative territory. This alignment confirms ongoing downward pressure.

The histogram bars are also negative and widening, indicating that the bearish trend is strengthening. This follows a recent bearish crossover where the MACD line dropped below the signal line, marking a shift from bullish to bearish conditions.
However, the steep decline in both lines suggests that selling momentum may be approaching exhaustion. If the MACD line starts flattening and turns upward toward the signal line, it could hint at a potential reversal. Combined with oversold conditions in the Relative Strength Index (RSI) and the bullish falling flag on the price chart, these signals collectively point to a possible shift toward recovery if momentum changes.
In its current state, the MACD reflects short-term bearish control but aligns with conditions often seen before a bullish reversal, especially when supported by strong technical patterns.
Solana Balance of Power (BOP) Analysis on August 1, 2025
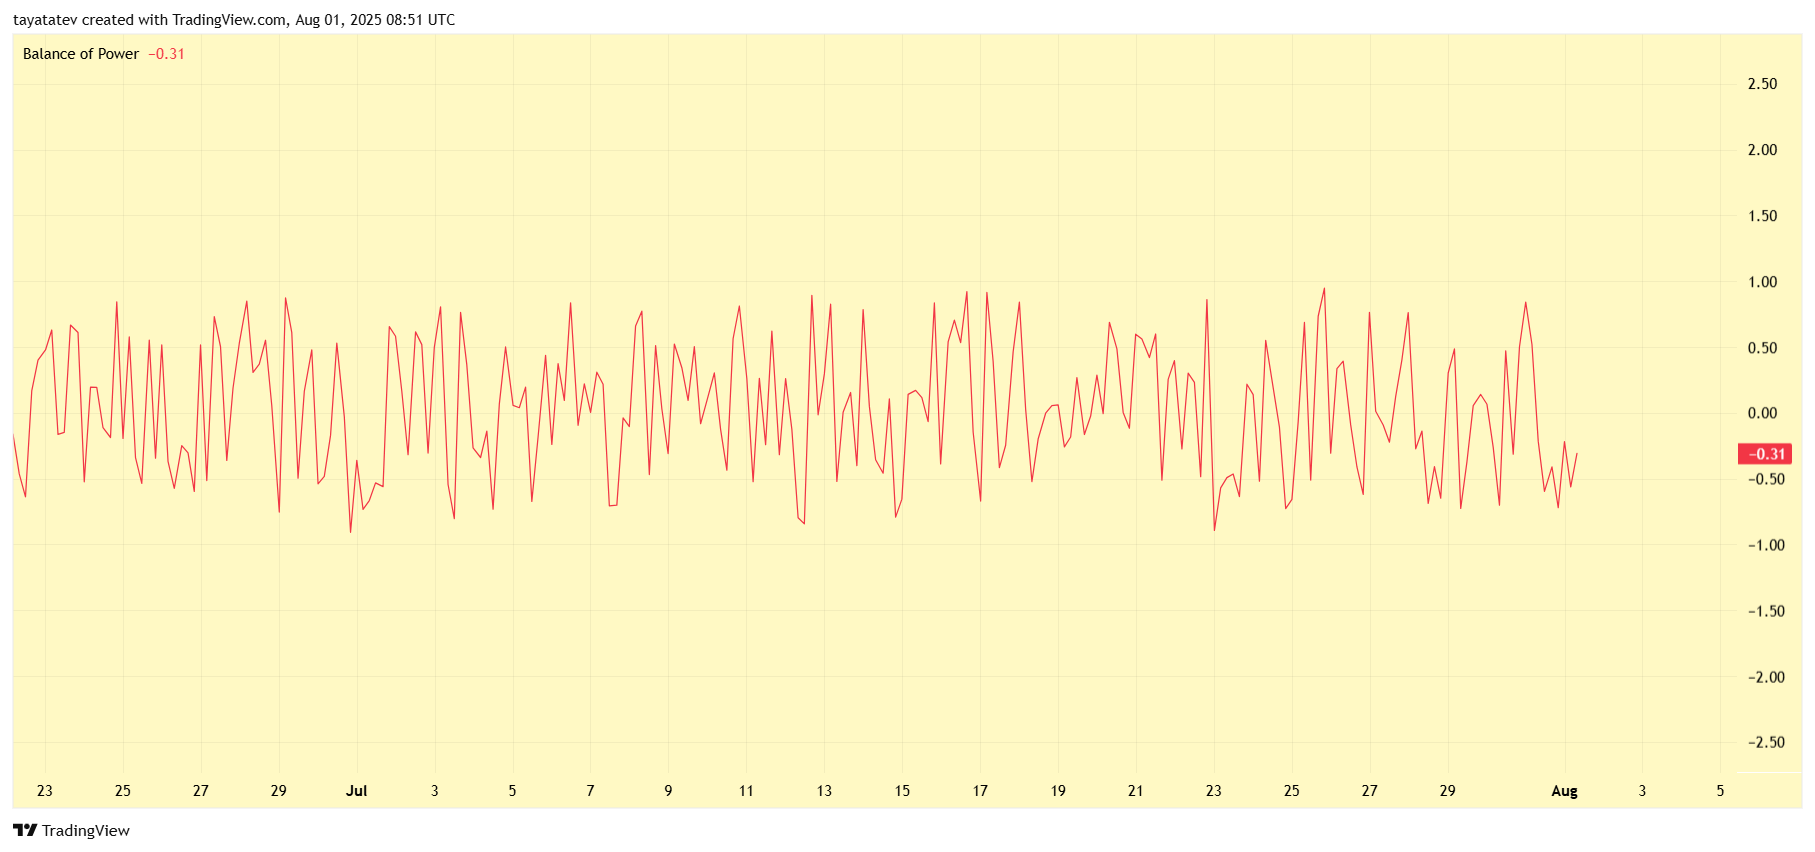
The Balance of Power (BOP) for Solana, as of August 1, 2025, is at -0.31, indicating that sellers currently hold more influence than buyers. Negative readings on the BOP reflect a shift toward selling pressure dominating the market.

The BOP has remained volatile in recent sessions, frequently oscillating around the neutral line but now trending downward. This suggests that bears are exerting greater control in the short term. The persistent negative reading aligns with recent price declines and confirms the bearish momentum visible across other indicators like the Moving Average Convergence Divergence (MACD) and Relative Strength Index (RSI).
Despite this, such negative pressure often coincides with oversold conditions, which can attract buying interest if market sentiment shifts. If BOP returns toward the positive zone, it could confirm growing buyer strength and support a potential breakout from the bullish falling flag pattern seen on Solana’s price chart.
In its current state, the BOP reinforces short-term selling dominance but also aligns with technical conditions that may favor a reversal if demand strengthens.