- Polkadot’s bullish breakout hinted at a 51% upside, with $7.89 and $9.23 emerging as key levels
- Market sentiment has improved lately, backed by steady funding rates, rising social volume, and balanced long/short positions
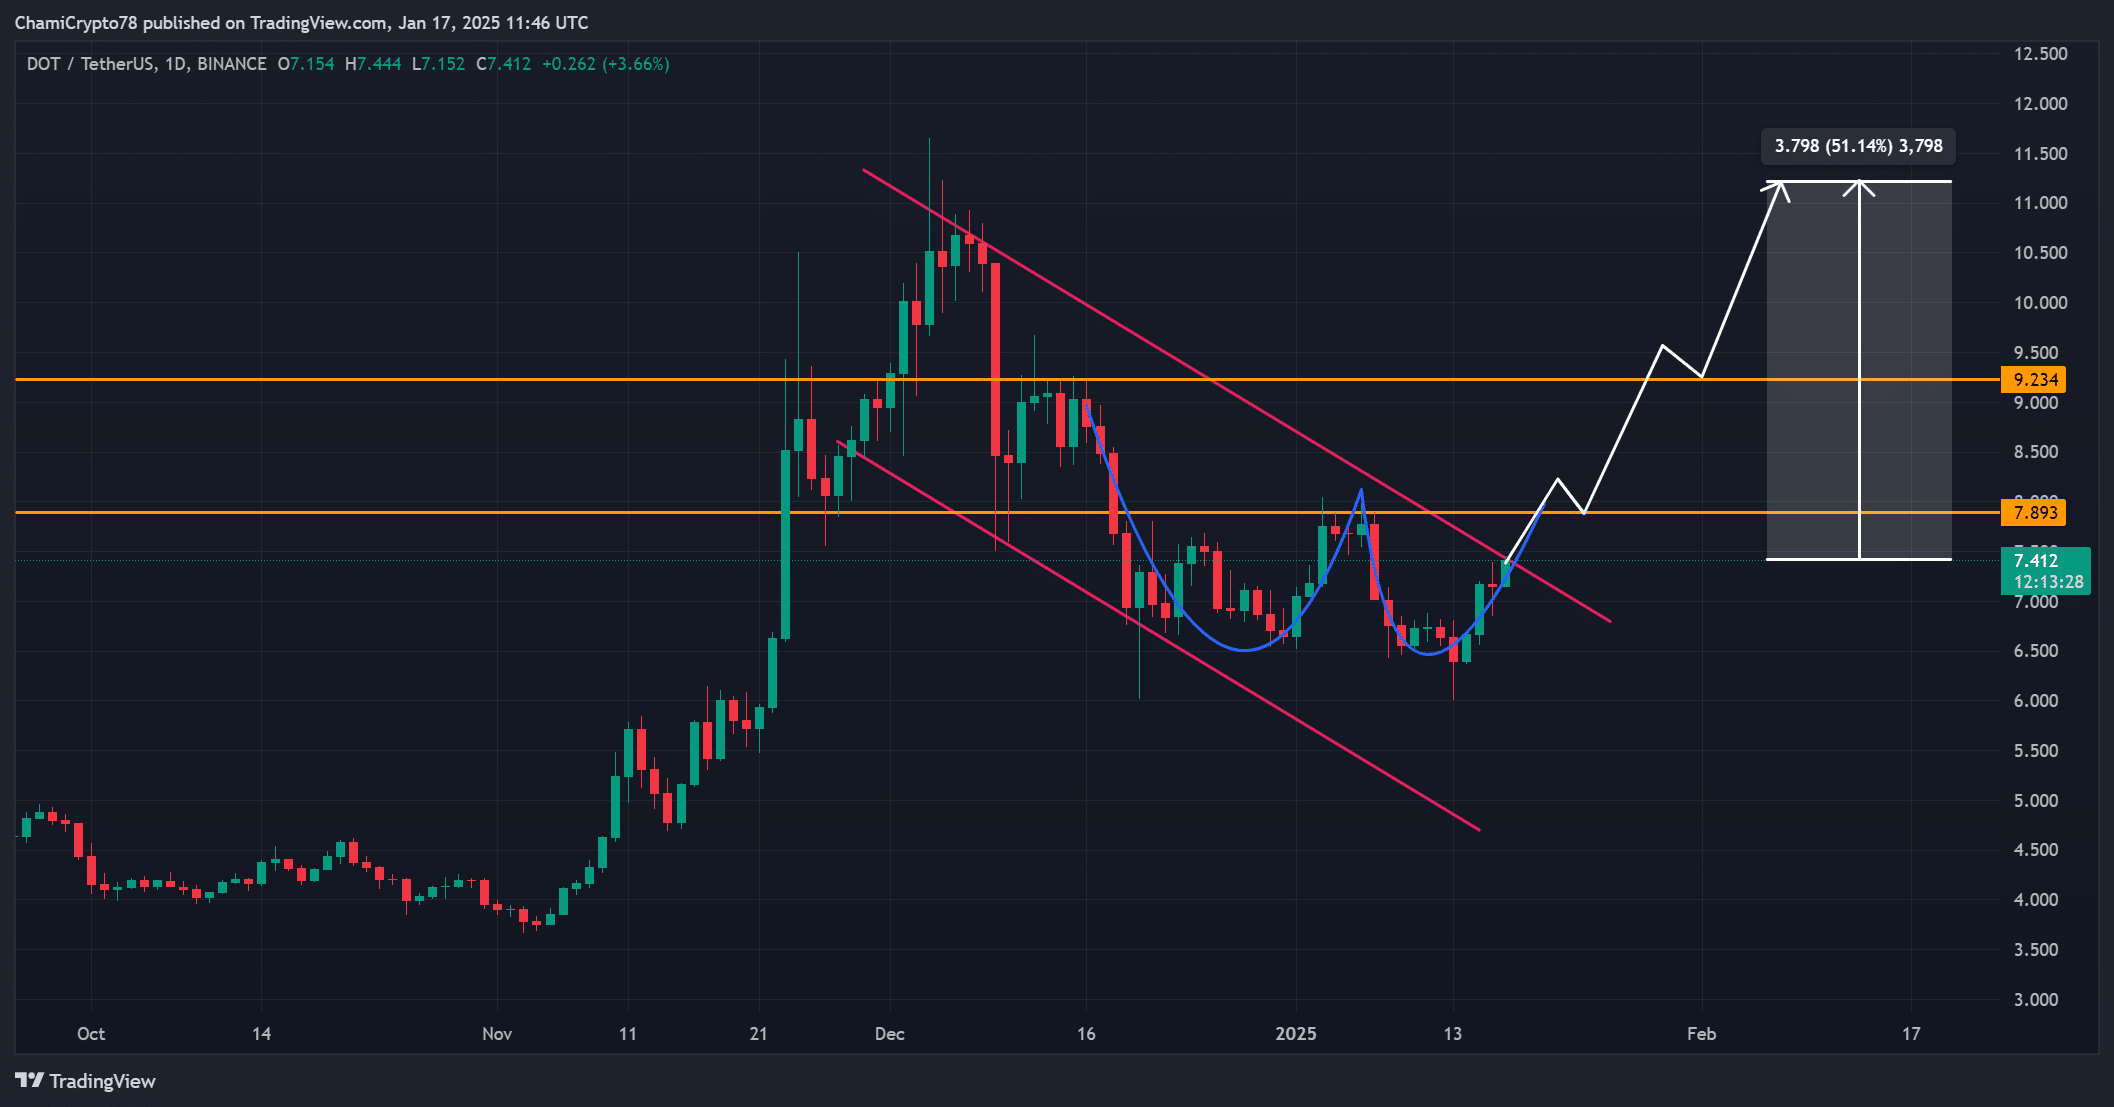
After weeks of bearish behaviour, Polkadot [DOT] gained some momentum on the price charts after breaking out from a falling wedge pattern on its daily chart.
At press time, DOT was trading at $7.42, following a 6.25% hike in 24 hours. As expected, this breakout has sparked optimism among DOT traders, who are closely monitoring key resistance levels. Hence, the question – Will Polkadot maintain its upward momentum and aim for $12 now?
Signs of bullish continuation?
Polkadot’s price action hinted at a clear path for further gains following the daily chart’s falling wedge breakout, with the same projecting a 51% upside potential.
In fact, the same highlighted other bullish patterns too, namely, a pennant flag and a cup and handle formation – Both supporting a move towards $9.23 if the $7.89 resistance is decisively broken. These patterns underlined the growing strength of buyers, positioning DOT for a significant rally on the charts.
However, failure to hold $7.89 may result in consolidation, delaying further upward movement. Therefore, holding above this level is critical for maintaining its bullish trajectory.

Source: TradingView
Binance funding rate reflects growing optimism
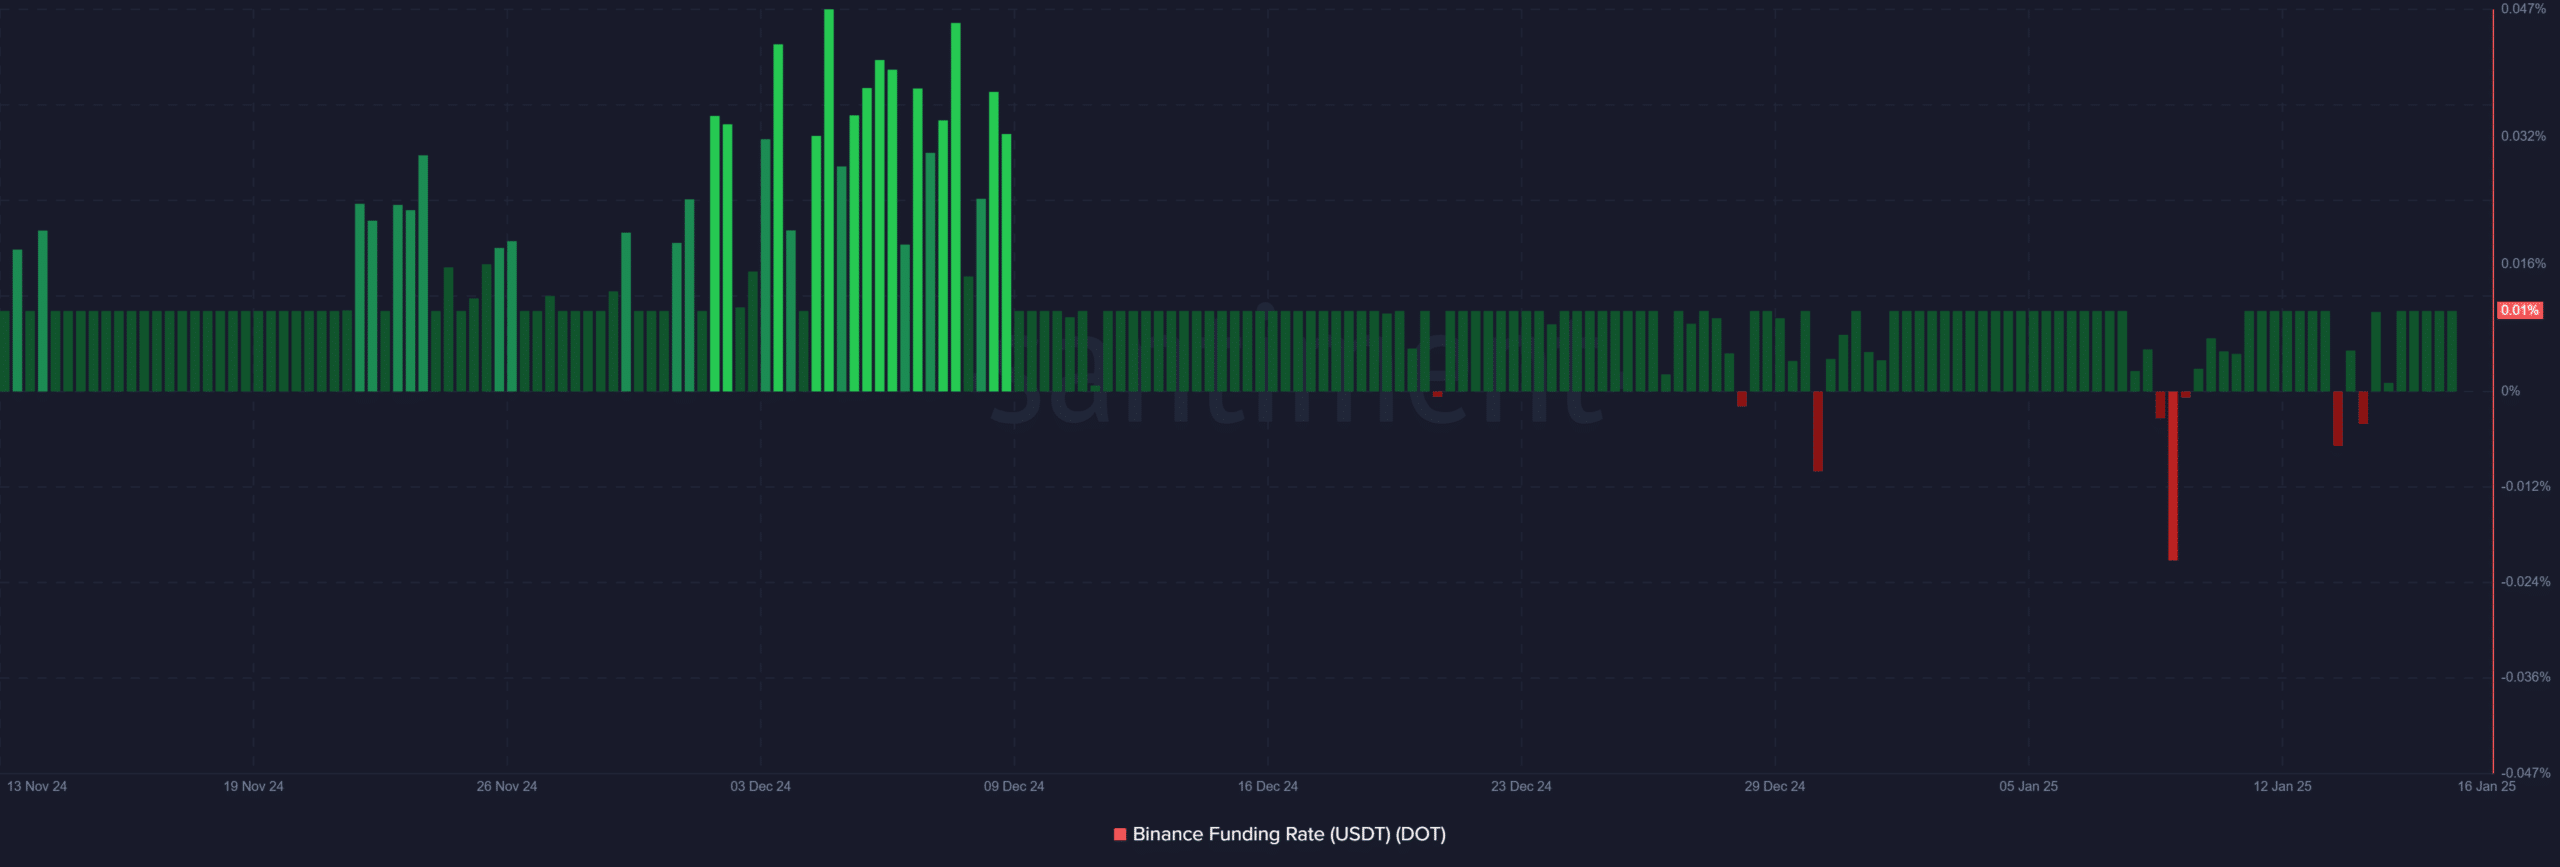
At the time of writing, the Binance funding rate for DOT had a reading of 0.01% – Highlighting an optimistic outlook among leveraged traders. It also hinted at increased demand for long positions, in support of the altcoin’s ongoing rally.
However, sharp hikes in funding rates could also mean excessive leverage in the market – Potentially leading to a correction.
Therefore, it is essential for funding rates to remain steady to avoid overextension. Additionally, stable funding conditions will likely encourage more traders to enter long positions, further driving upward momentum.


Source: Santiment
Social volume shows growing trader interest
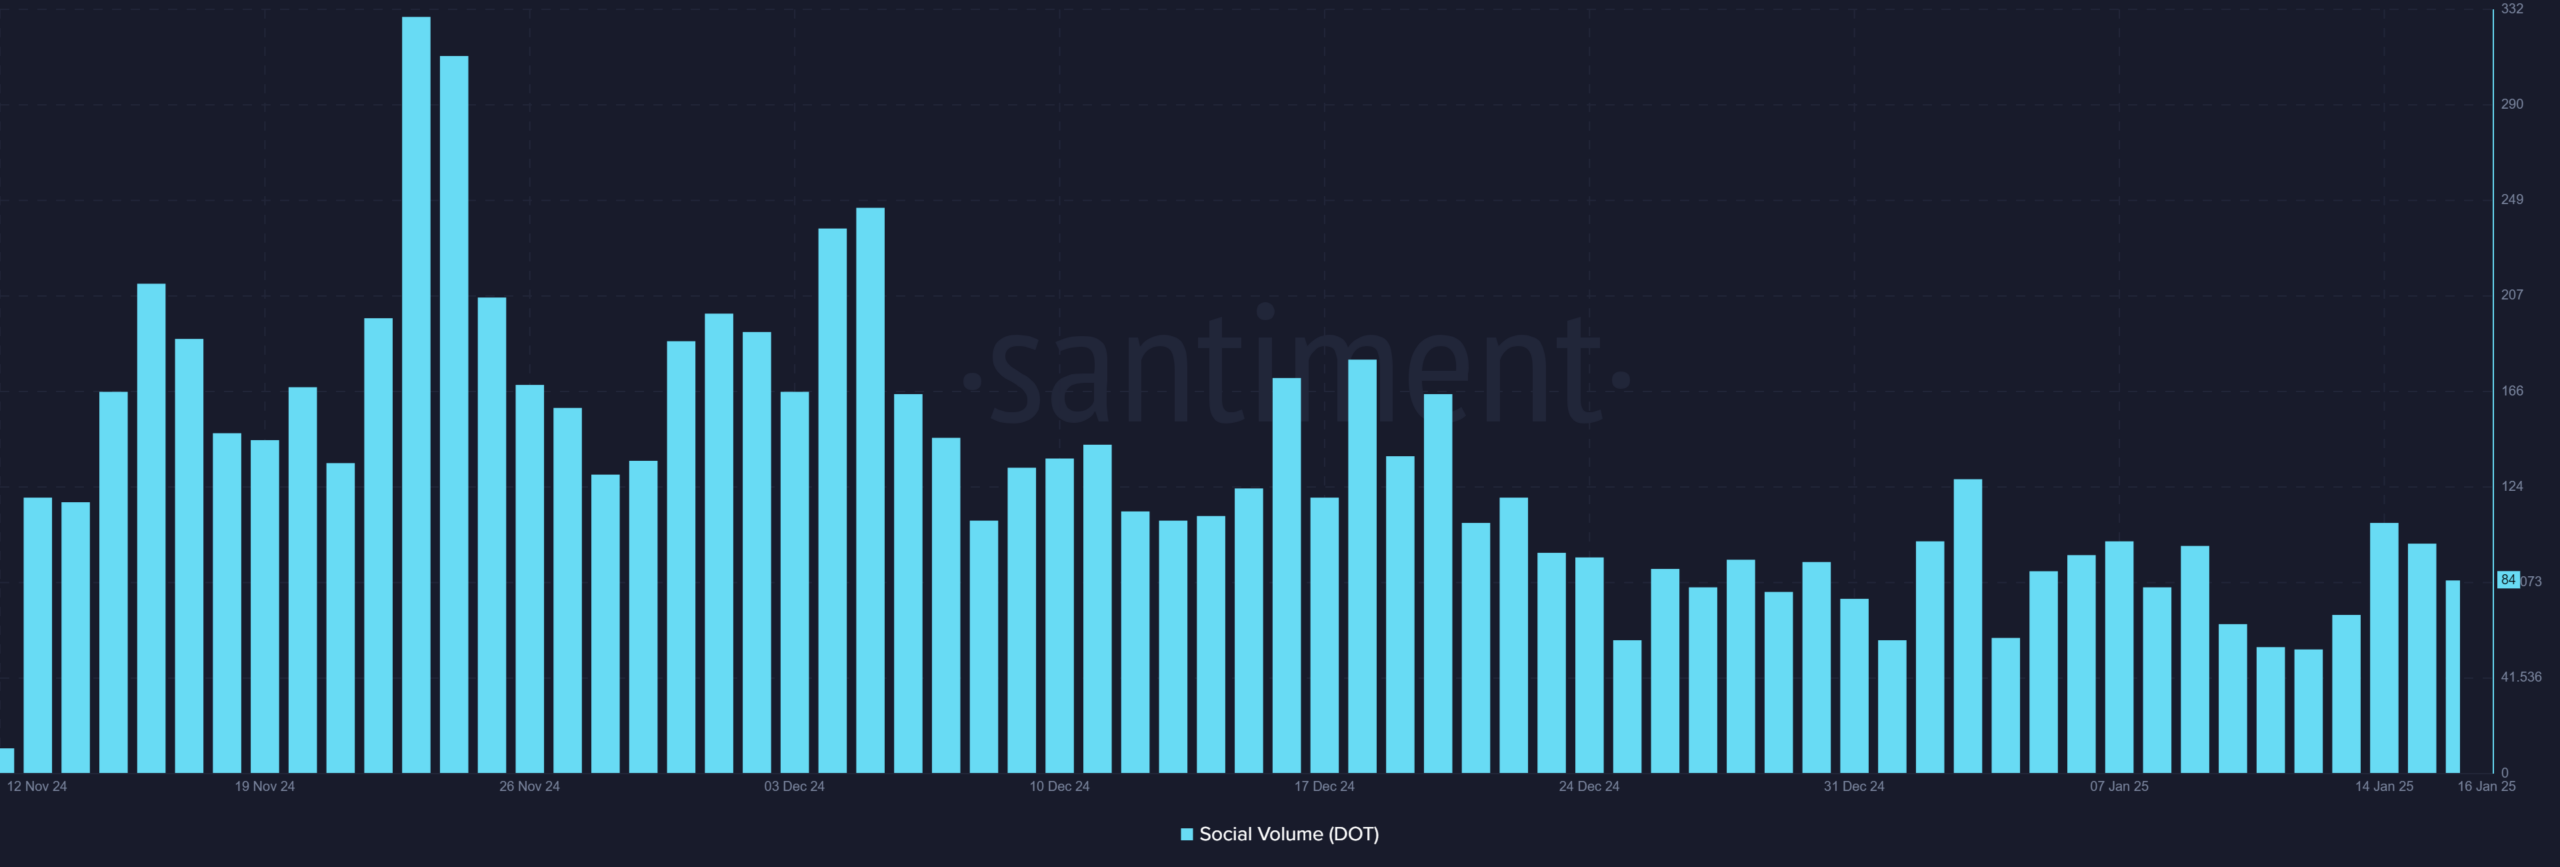
DOT’s social volume has been steadily increasing too, with recent data showing 84 mentions within the last day. Now, although this figure is slightly lower compared to previous spikes, the overall trend remains positive – A sign of growing community interest.
What this means is that more traders are now discussing DOT, which often correlates with heightened trading activity. In fact, strong social engagement could lend the buying pressure needed to push DOT beyond $9.23.


Source: Santiment
Time for caution?
Finally, the long/short ratio for DOT highlighted 49.13% long positions and 50.87% short positions, indicating some degree of cautious sentiment across the market. While it seemed to lean slightly bearish, the aforementioned balance suggested that neither side is dominating so far.
However, a shift towards higher long positions could signal renewed confidence in the rally. Therefore, a clear tilt in favor of longs may be necessary for DOT to sustain its bullish breakout.


Source: Coinglass
Read Polkadot [DOT] Price Prediction 2024-2025
Is $12 realistic for Polkadot?
Polkadot’s breakout, supported by bullish technical patterns and positive market dynamics, makes a rally towards $12 highly likely.
With strong price action, growing social interest, and optimistic funding rates, DOT may be poised for further gains. Therefore, if the asset holds above $7.89 and breaks through $9.23, a move to $12 could be just around the corner.