- Bitcoin’s 1-year percentage change is nearing the negative zone
- Previous dips have led to downturns, but 2020’s example suggests there might be hope for recovery
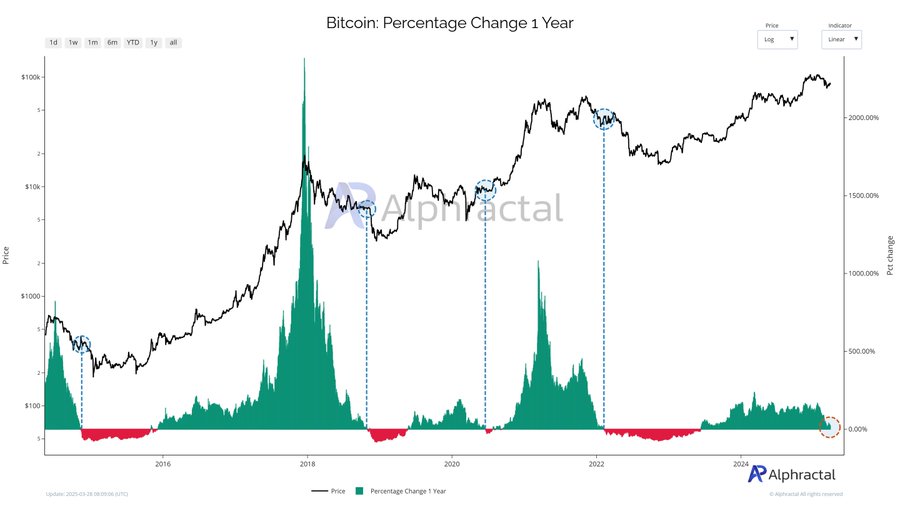
Bitcoin’s [BTC] 1-year percentage change is approaching the negative zone – A signal that has historically been associated with bearish market trends. While three out of the last four instances of such a dip led to declines, there’s a chance that this time might mirror 2020’s market behavior. Back then, the negative shift was part of a broader consolidation phase.
If this downward trend continues, it could signal the potential for new lows in the near future.
1-Year percentage change – Significance of the negative zone
The 1-year percentage change of Bitcoin tracks its price difference over a rolling 12-month period, serving as a key indicator of market sentiment. When this metric enters the negative zone, it shows that Bitcoin’s price is lower than it was a year ago.
Historically, this has been linked to bearish momentum, signaling waning buying interest or a hike in selling pressure. In fact, out of the last four instances, three led to sustained downturns, while one had minimal impact.
Now, while the negative zone hinted at reduced volatility and lower risk, it doesn’t always guarantee further losses. External factors also play a role.
What does the data say?
Alphractal’s chart revealed that Bitcoin’s 1-year percentage change, alongside price movements, marked four key periods when the metric dipped below zero.
The first instance in 2015 was a brief dip during recovery from 2014’s bear market. The longest negative phase occurred between 2018 and 2019 after Bitcoin fell from $20,000 to around $3,200. A short negative period in 2020 was linked to COVID-19 market disruptions, while the most recent episode in 2022 followed the drop from $69,000 to below $20,000.

Source: Alphractal
It is March 2025 now and Bitcoin’s 1-year percentage change is nearing zero – A sign og potential movement into the negative zone. Analysts are divided on whether this indicates a consolidation phase or the risk of a new bearish cycle.
The case for consolidation
Risks of sustained negative movement
Bitcoin’s 1-year percentage change moving into the negative zone could signal a further decline on the charts. Previous instances show sustained negative movement often correlates with bearish trends, indicating lost momentum.
If the metric drops below zero, it may suggest the rally has stalled, prompting a risk-off approach.
External factors could deepen this downturn. Prolonged negativity may pressure Bitcoin to retest support levels, triggering panic selling and a deeper bear cycle.
Next: Shiba Inu [SHIB] price prediction – Mapping short-term targets as selling pressure climbs
