Bitcoin failed to break through the key $94,000 level on 3 December, underscoring the market’s increasingly fragile structure. On-chain data shows more than a quarter of all BTC supply has slipped into unrealized loss.
The rejection aligns with a critical threshold identified by Glassnode’s Supply Quantiles Cost Basis Model, which tracks the cost basis of large segments of circulating supply to measure structural risk in the market.
Bitcoin on-chain quantiles show rising structural risk
According to Glassnode, Bitcoin fell below its 0.75 cost-basis quantile in mid-November, meaning that over 25% of the supply, predominantly held by top buyers from recent months, is now underwater.
Historically, this zone marks a pivotal phase where markets balance between capitulation pressure from late entrants and the early stages of seller exhaustion often seen near cyclical bottoms.
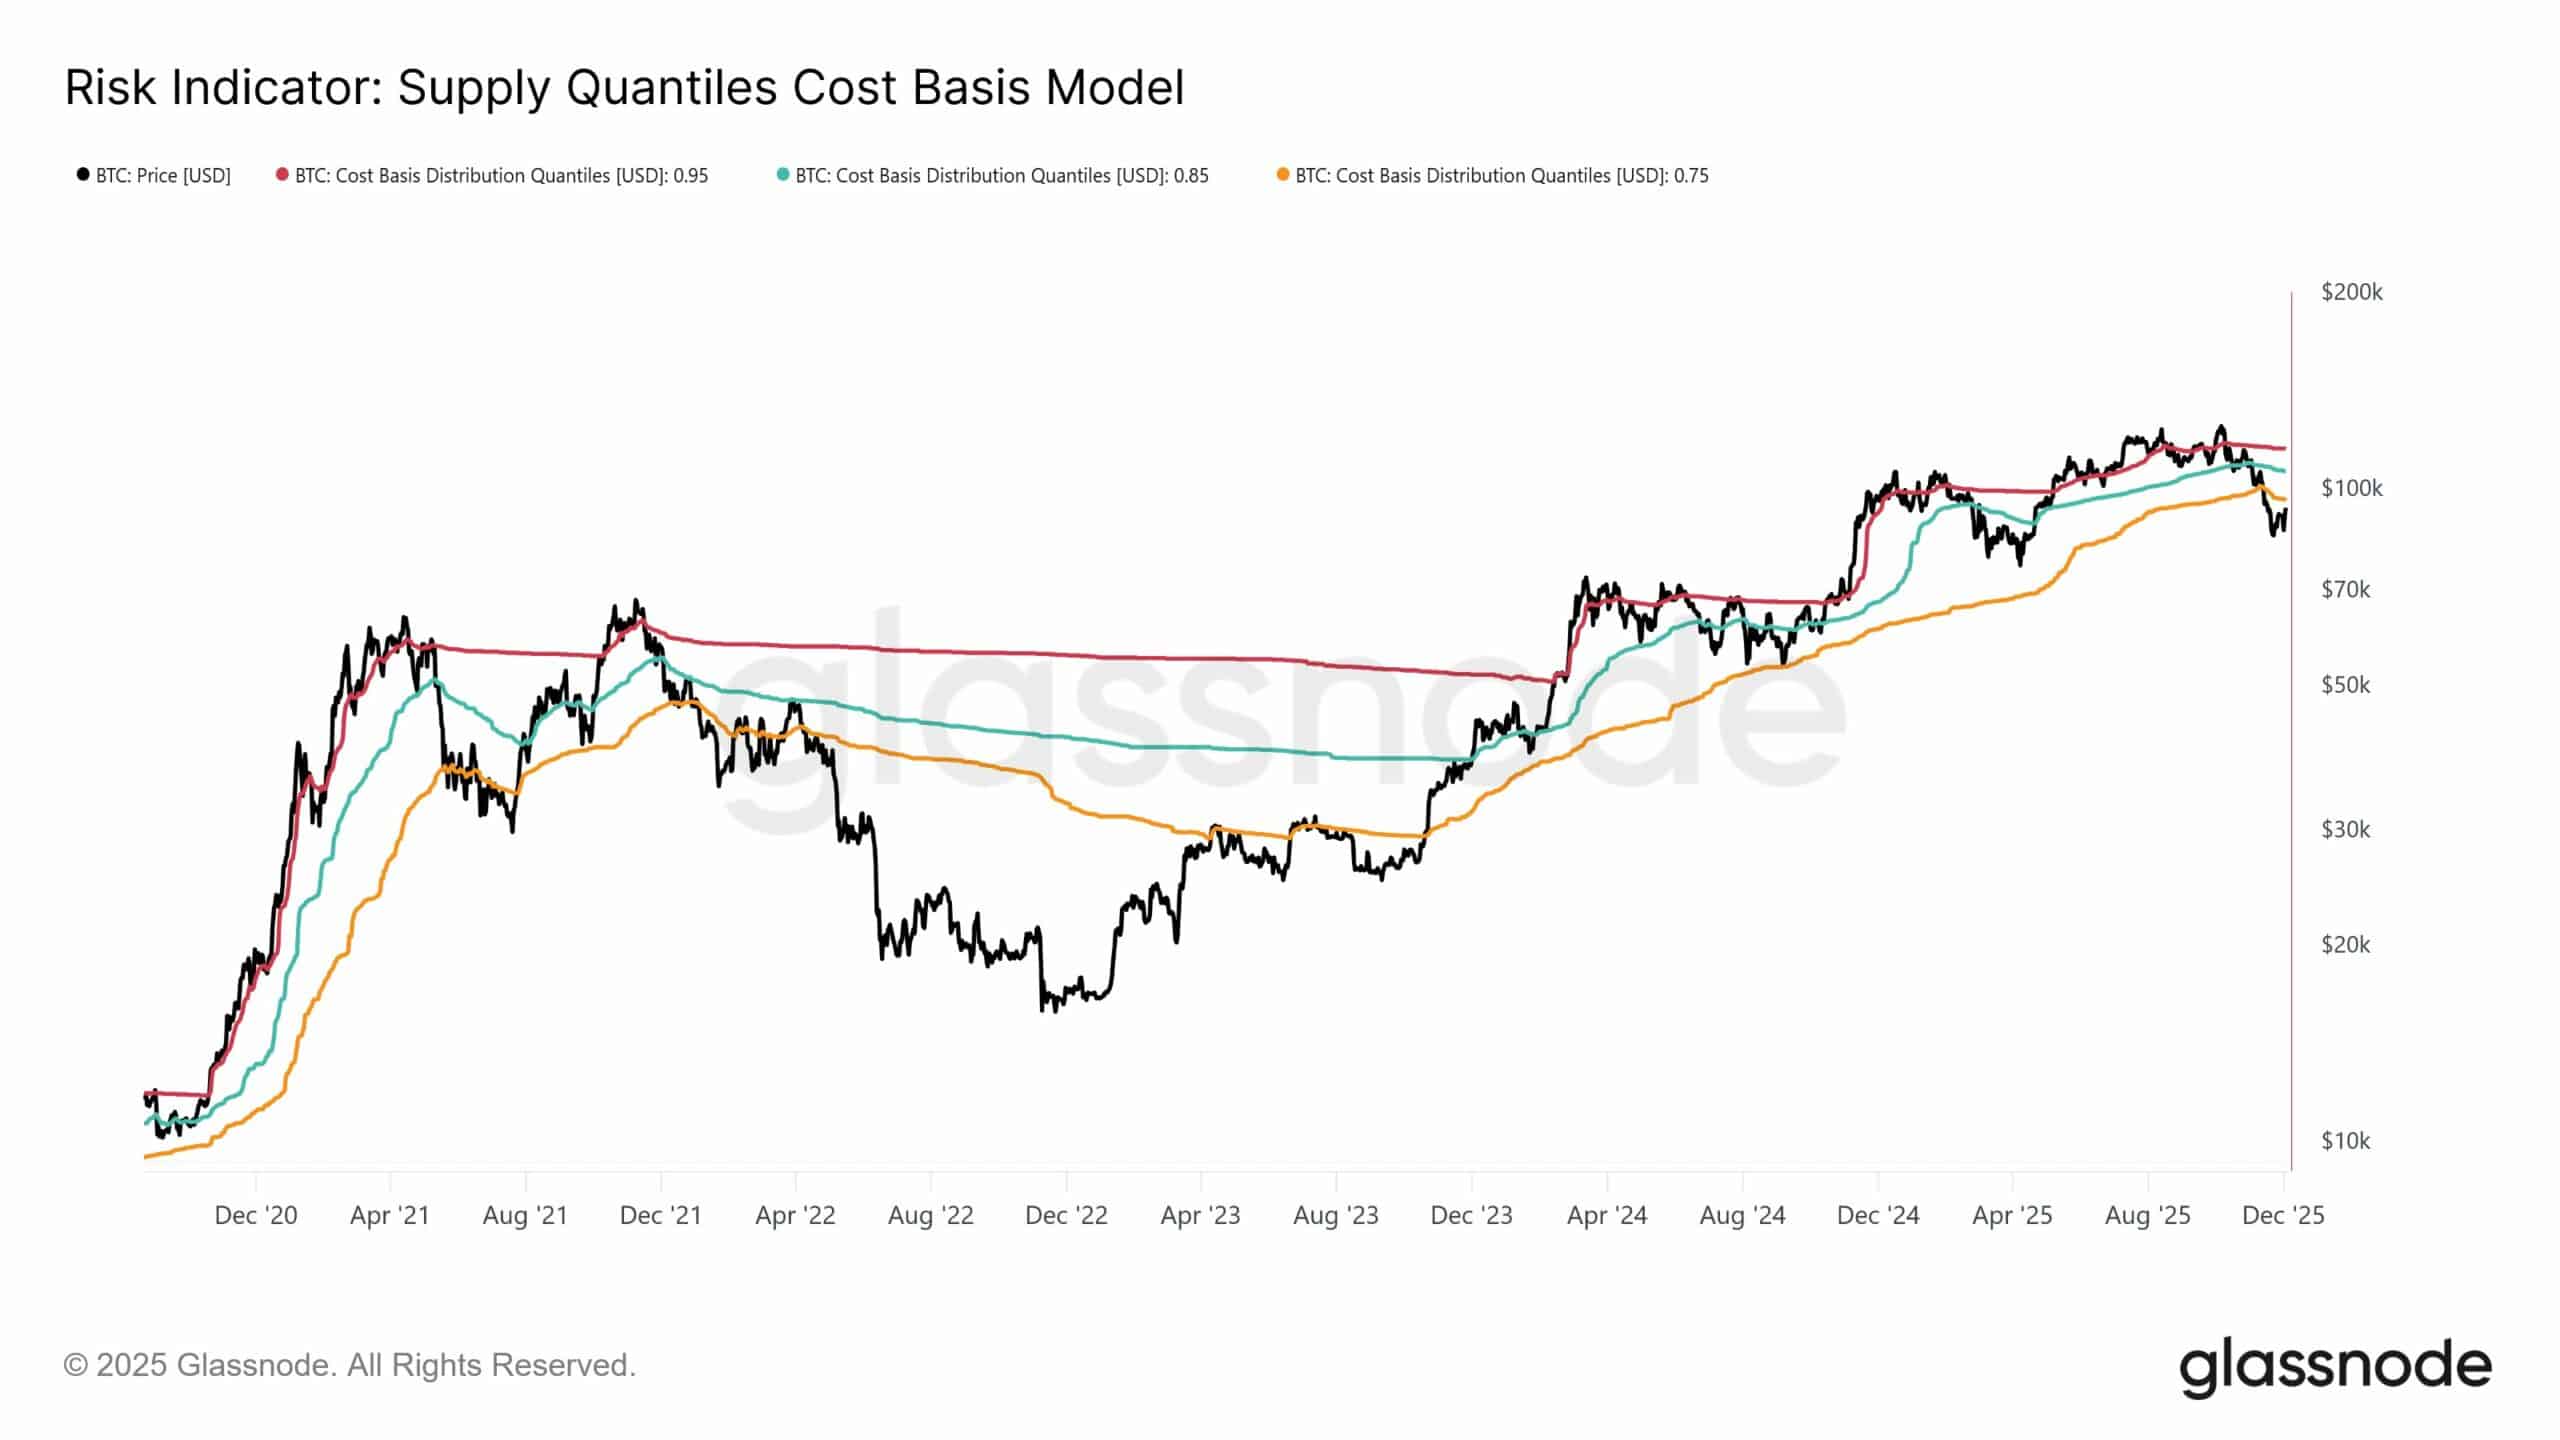
Source: Glassnode
Since breaching this threshold, Bitcoin has shown heightened sensitivity to macro conditions and has struggled to regain upward momentum.
Rejection at $94K confirms resistance at key cost-basis levels
The significance of the 0.75 quantile became clear when Bitcoin attempted to reclaim the $94K region on 3 December, only to reverse sharply and close lower.
Price currently sits near $92,500, reinforcing the idea that the market cannot establish stability until it recovers the 0.75 quantile near $95,800.
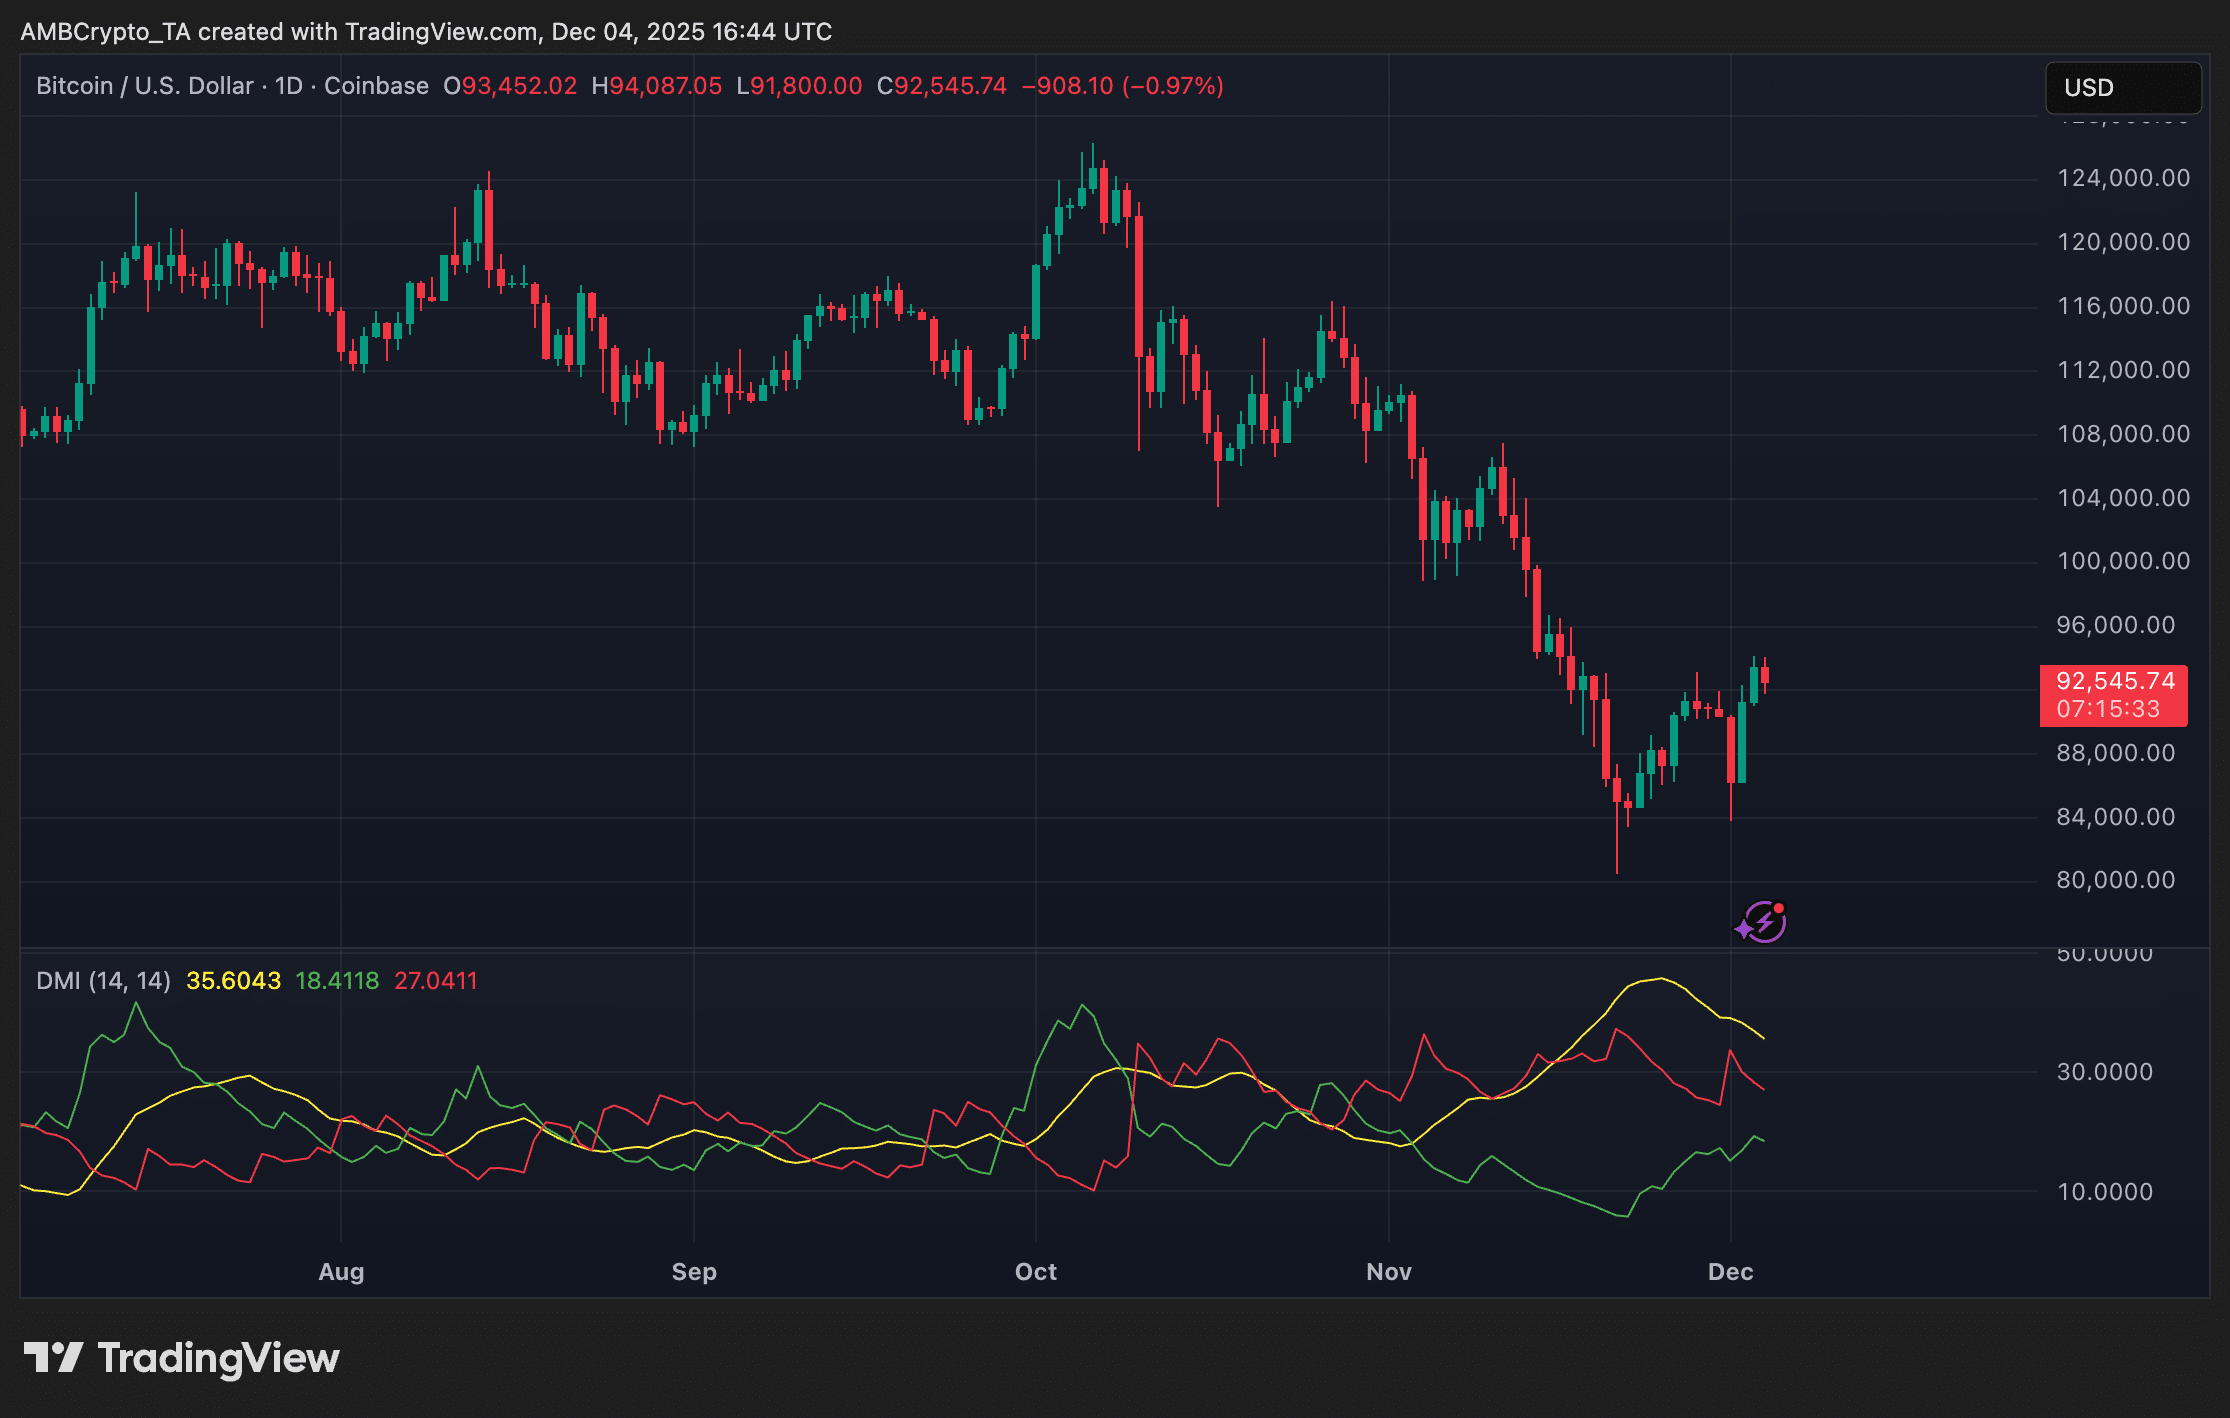
Source: TradingView
A more decisive structural shift would require a break above the 0.85 quantile at roughly $106,200. This is a zone where long-term trends historically strengthen, and downside risk tends to diminish.
Bitcoin technical indicators reflect weakening momentum
Market structure on the daily chart aligns with the on-chain picture. The DMI shows fading bullish strength as the positive directional index loses momentum while sellers regain traction.
The ADX, while still elevated, has begun to flatten, signalling compression and indecision in the prevailing trend.
The failed higher-low progression on the chart further suggests that buyers lack the conviction to overcome the resistance embedded in the current cost-basis distribution.
Macro sensitivity increases as underwater supply grows
With more than a quarter of supply in loss, market sentiment remains unusually dependent on external catalysts.
Even moderate macro shifts, such as movements in bond yields or changes in liquidity conditions, may exert outsized influence until Bitcoin can reclaim at least the 0.75 quantile and ease pressure on recent buyers.
Until then, price action sits between two possible outcomes: a deeper reset driven by top-buyer capitulation or a stabilization phase aided by seller exhaustion.
Final Thoughts
- Bitcoin’s failure at $94K confirms on-chain resistance levels and highlights how exposed recent buyers remain below $95.8K.
- The next decisive move depends on whether the market absorbs this underwater supply or breaks down under continued macro pressure.